
Statistics on the course of the COVID-19 pandemic in Greece and a comparison with other countries, for the period up to 1 Jul 2022.
The main finding
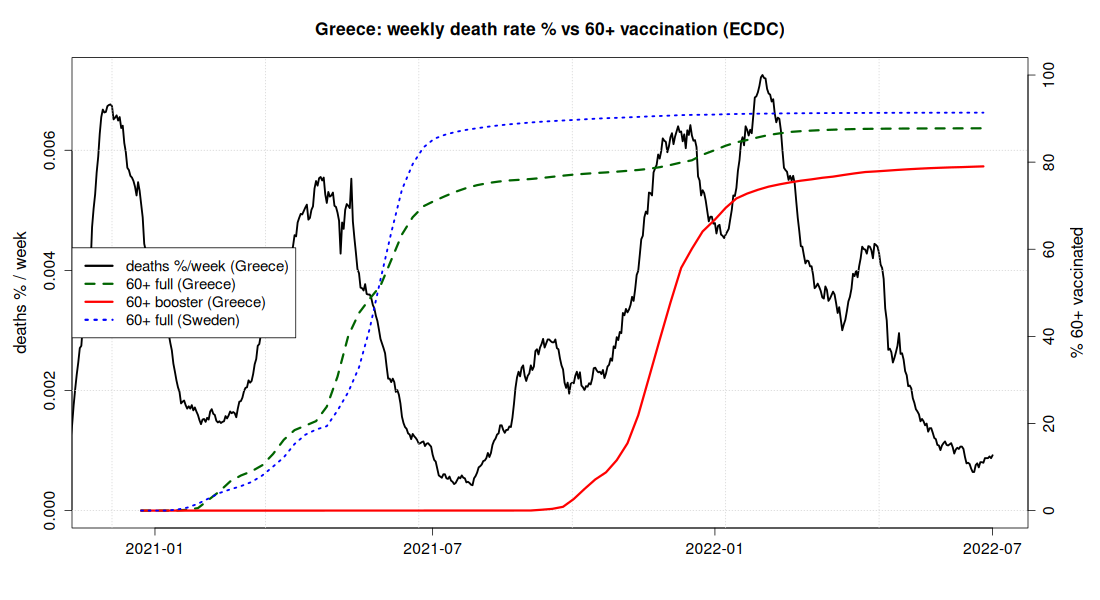
In a comparison of eight countries, the lower the vaccination coverage of the elderly, the heavier the price in deaths. The relation holds across the whole sample with one exception, Greece: with 60+ coverage at 88%, essentially the same as France's 90%, it lost 1,683 people per million after vaccination, against 553 for France.
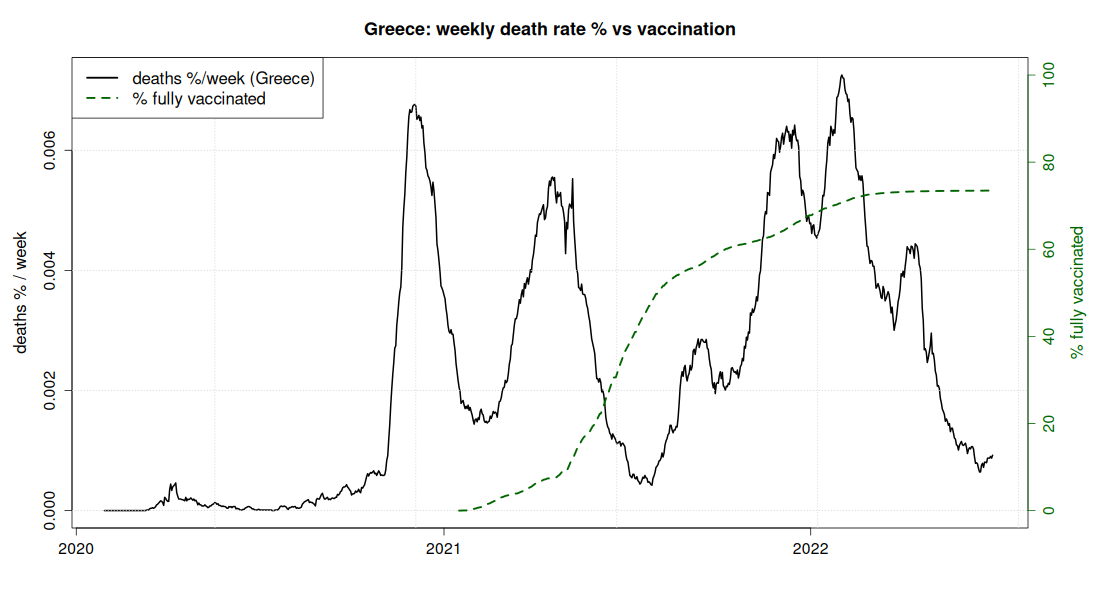
Greece started from an advantageous position: it came through the first wave almost untouched, with fewer deaths than any other country in the study, but ended up with more than most. The reversal is extreme: at the start of the second wave Greece had the best record in the sample, while at the end of the period it stood above countries that had already paid a far heavier price back in 2020. The figures that follow show that this shortfall does not appear to be adequately explained by vaccination coverage, nor by the number of recorded infections, nor by differences in how deaths were recorded.
In detail, with the data and the caveats →
Greece
Greece compared with other countries
Deaths & Vaccination
ICU: beds and staff
The main finding: the Greek exception
The comparison of eight countries (Greece, France, the Netherlands, Sweden, Italy, Bulgaria, Romania, Croatia) shows a clear relation between the vaccination coverage of the elderly and deaths: the lower the coverage, the heavier the price. Almost the whole sample follows this pattern. The main exception is Greece, which is why the reference country here is France, with almost the same 60+ coverage but far lower post-vaccination mortality.
| Country | 60+ fully vaccinated | Deaths/million after vaccination |
|---|---|---|
| Netherlands | 94% | 270 |
| Sweden | 91% | 445 |
| France | 90% | 553 |
| Italy | 89% | 675 |
| Greece | 88% | 1,683 |
| Croatia | 75% | 1,915 |
| Romania | 40% | 1,657 |
| Bulgaria | 35% | 2,762 |
Click a column heading to sort the table.
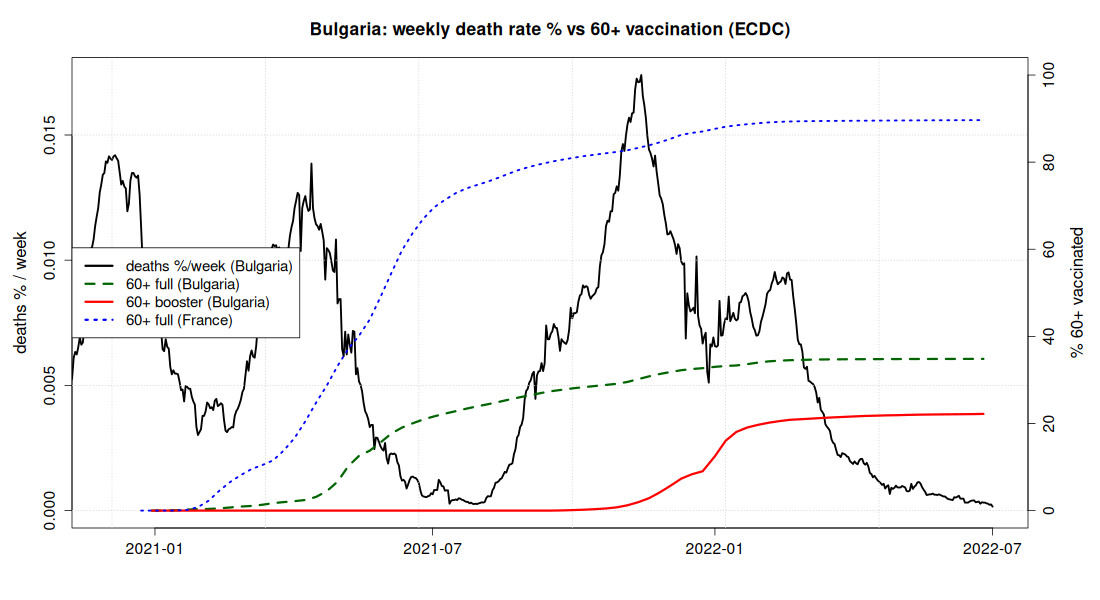
The deaths column measures the period after 1/7/2021, that is once substantial vaccination coverage existed. The Netherlands, Sweden, France and Italy, with coverage from 89% to 94%, lost between 270 and 675 people per million. Bulgaria and Romania, at 35-40%, stand several times higher. Croatia, with intermediate coverage and a very low booster rate, sits roughly where its percentages place it.
Greece fits nowhere in this picture. With 60+ coverage at 88%, essentially the same as France's 90%, it has mortality at Romanian levels, that is three times France's. 58% of all Greek deaths occurred after vaccination, whereas in France, Italy and Sweden the corresponding share is 23-25%. And in the Omicron wave Greece had almost the same deaths as Croatia (902 against 852 per million) even though it had a 76% booster rate among the 60+ against Croatia's 46%: a thirty-point advantage that left no trace anywhere.
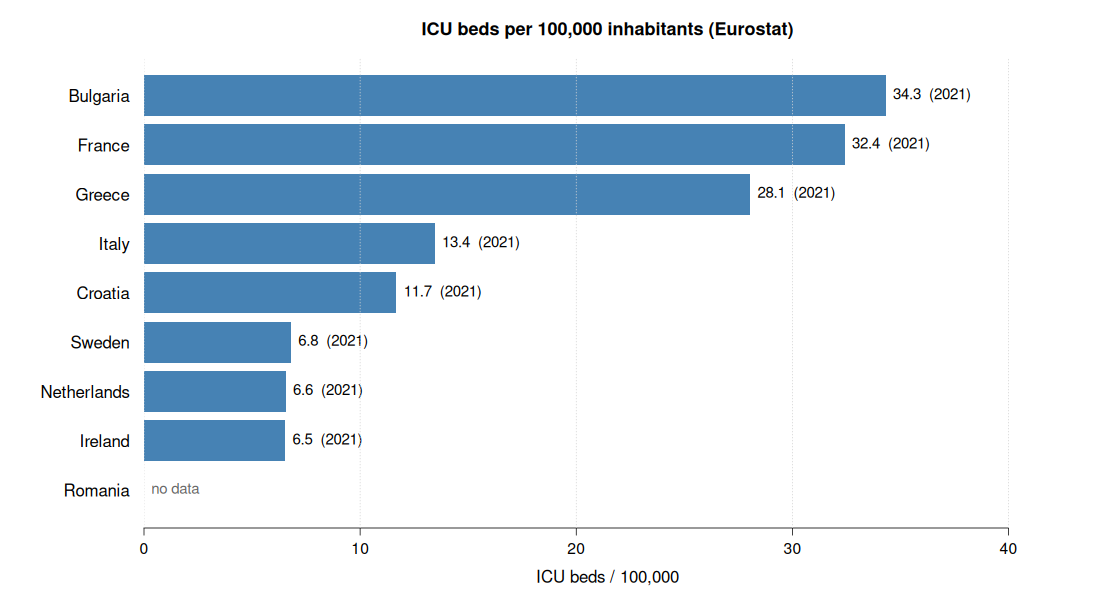
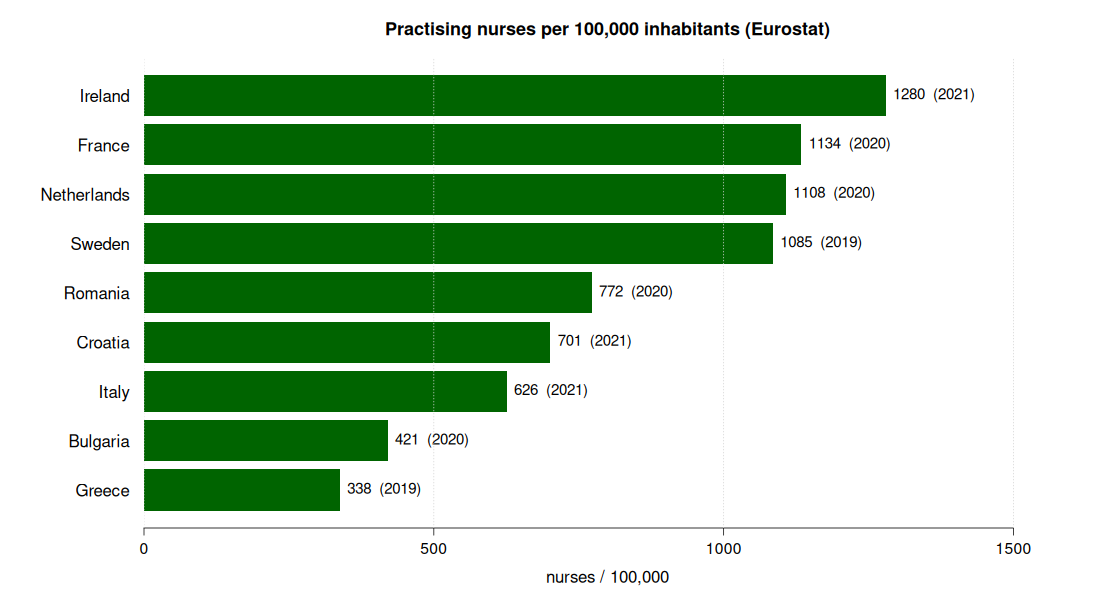
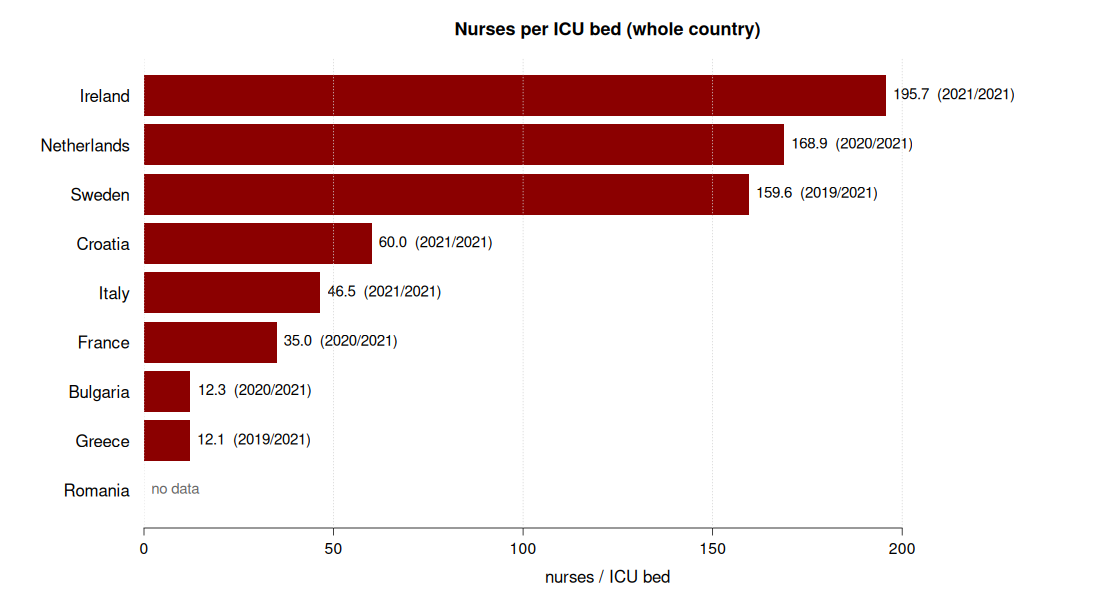
If coverage does not explain Greece, something else must. The first candidate explanation, intensive care infrastructure, gives an unexpected answer: in the official Eurostat figures Greece reports more ICU beds than Italy and Sweden and almost as many as France (on the basis of published sources the real number of beds in operation was clearly smaller than the reported one, and the same appears to hold for France, so the Eurostat ICU bed indicator is not reliable for comparisons). With the national operational capacity figures, in any case, the two countries reached the peak of the crisis at almost the same number of beds per inhabitant (15.8 and 15.1 per 100,000). In nurses, however, Greece is last in the sample, with 338 per 100,000 inhabitants against France's 1,134, that is 12 nurses per ICU bed against 35. The figures suggest that the main Greek deficit was not the number of beds as such, but the staff needed to operate them.
On the basis of the figures we can check, understaffing emerges as the strongest available explanation. Greece has the lowest staffing in the sample and at the same time a high number of deaths per admission: 17.7% of those hospitalised died, against 11.7% in France, that is one and a half times more. And only 7.7% of those hospitalised were moved on to ICU, against 14.7% in France, that is half the escalation, with almost the same number of ICU beds per inhabitant at the peak of the crisis. The most telling point is that Greece hospitalised twice the share of its population that France did: when you admit more patients, lighter cases come in too and fatality per admission ought to fall, not rise.
The indication is reinforced by the comparison with the other countries. The more selectively a country hospitalises, the heavier the cases it admits and the more deaths per admission one would reasonably expect: France hospitalises 0.47% of its population and loses 11.7 per 100 admissions, Spain 0.42% and 13.9, Italy 0.35% and 19.6: an almost perfect relation. Greece, which hospitalises two to three times more broadly than all of them, ought by the same logic to have the lowest fatality per admission. It has the second highest, 17.7%.
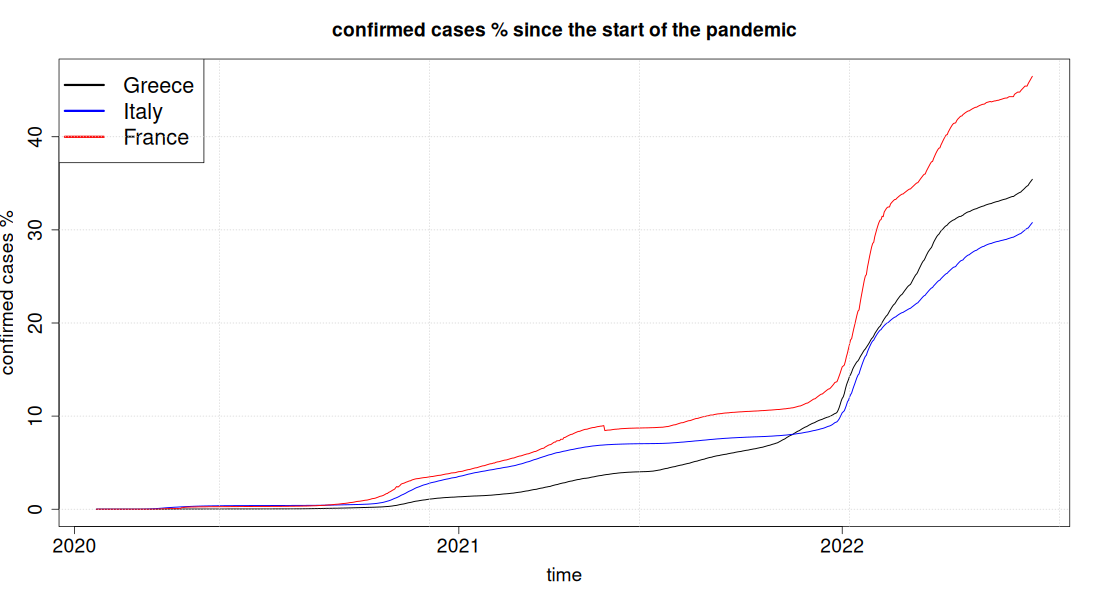
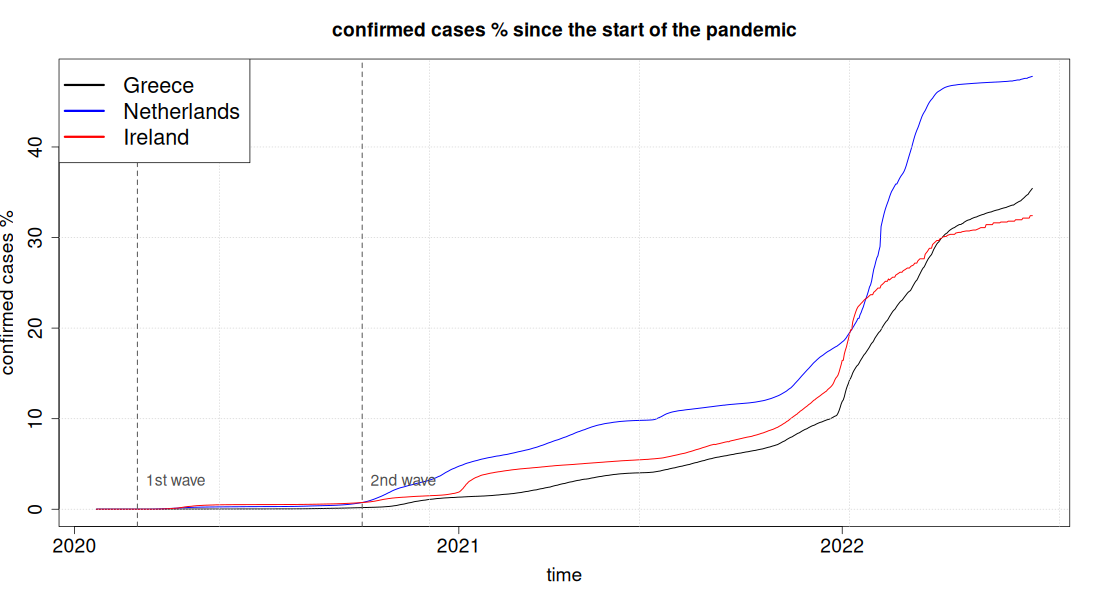
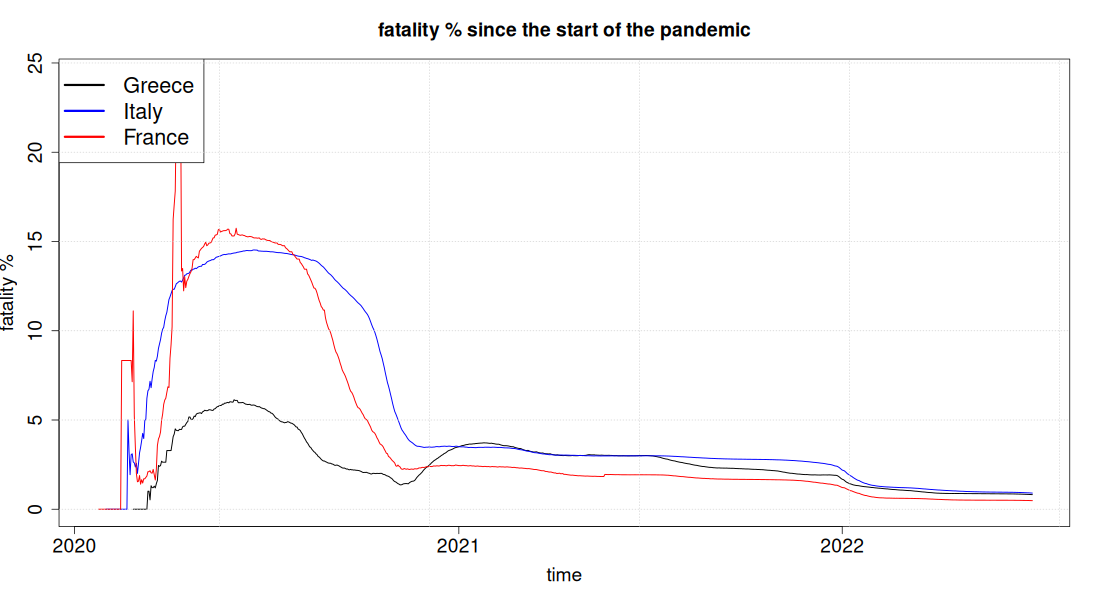
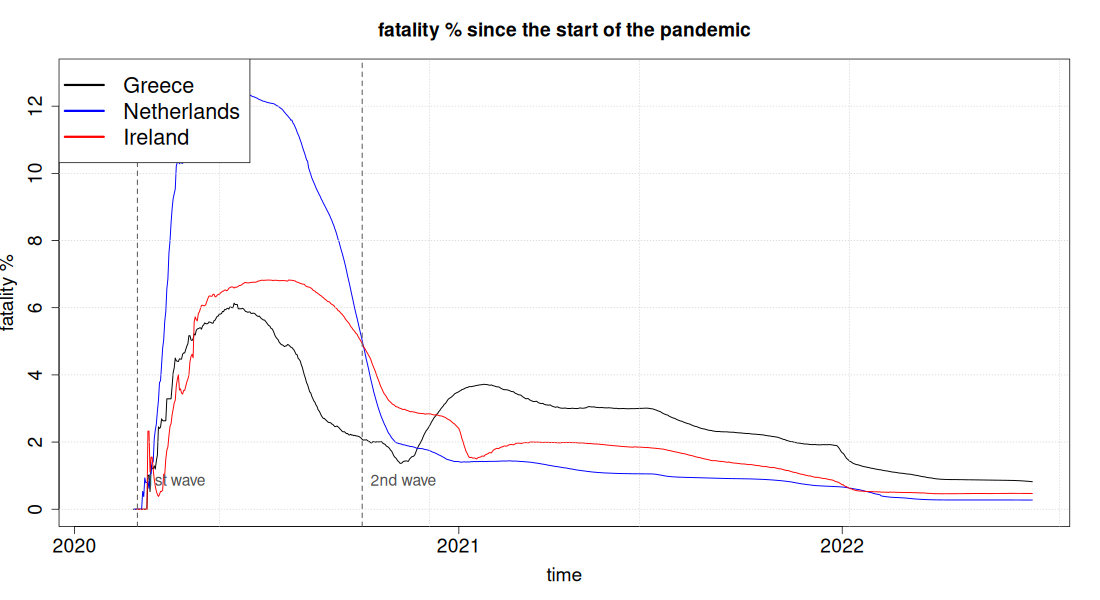
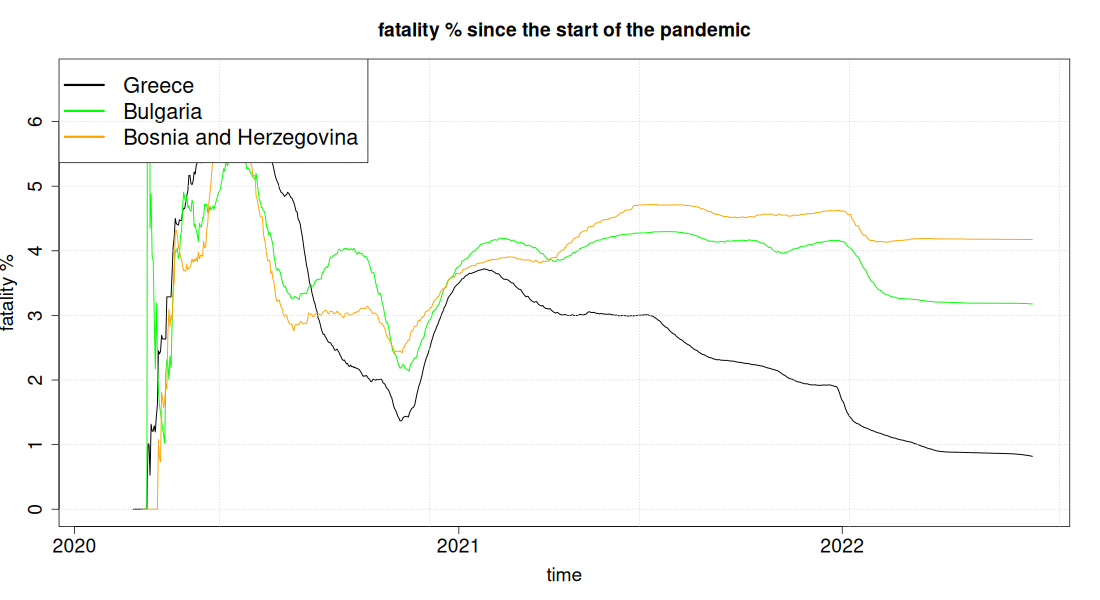
The same shows with an indicator independent of hospitalisation: deaths per 100 recorded cases. Greece 0.54, Czechia 0.39, Spain 0.30, Italy 0.28, Ireland 0.19, France 0.15, the Netherlands 0.07. And here an easy explanation must be rejected: it is not that more Greeks were infected. Greece recorded fewer cases than France (31.4% against 37.5% of the population) and had three times the deaths: ×0.84 in recorded cases, ×3.64 in deaths per recorded case. Fewer records, three times the deaths per record. Indeed, if Greece was detecting a smaller share of its infections than France, the difference would be even larger, not smaller.
Two explanations therefore remain, which the data cannot separate from each other: who got infected (that is, whether the infection reached unprotected elderly people disproportionately) and what care those infected found. The second is the one that leaves a mark on every indicator we were able to check.
One serious caveat remains: might Greece simply be counting differently? If it records as a COVID death every death with a positive test while other countries record only those due to the disease, part of the difference would be an accounting artefact. The question is answered by excess mortality, which measures how many more people died in total compared with what was expected on the basis of 2015-2019, independently of what is classed as a COVID death.
| Country | Excess mortality/million | Recorded COVID deaths/million | Ratio |
|---|---|---|---|
| Greece | 2,233 | 1,683 | 1.33 |
| Italy | 944 | 675 | 1.40 |
| Czechia | 835 | 935 | 0.89 |
| Netherlands | 830 | 270 | 3.07 |
| Spain | 671 | 582 | 1.15 |
| Ireland | 529 | 506 | 1.05 |
| France | 426 | 553 | 0.77 |
Click a column heading to sort the table.
Period 1 Jul 2021 - 1 Jul 2022. Source: Our World in Data, based on the Human Mortality Database and the World Mortality Dataset.
The answer is categorical and the opposite of the suspicion: Greece does not over-record, it under-records. Its real additional deaths (2,233 per million) are a third more than those recorded as COVID (1,683). In France the reverse happens: excess mortality is just 426 per million, that is 77% of its recorded COVID deaths.
By the measure that depends on no definition, then, the Greek shortfall does not shrink; it grows. In the course of one year after vaccination Greece lost 2,233 additional people per million inhabitants and France 426: five times more, not three. The "we just count differently" explanation is not enough to account for the Greek difference, and the available figures rather point the other way.
Two further possible causes are not tested here, but deserve mention. The first is that the national average hides large regional variation: at the end of October 2021, of the country's nine regional units with vaccination coverage below 50%, five were in Macedonia and Thrace (Drama, Kilkis, Pella, Pieria, Serres). In full vaccination Kilkis stood at 41.7% and Florina at 47.7%, while the autumn wave was being described in those days as a wave that developed first in Northern Greece and then in the rest of the country. In late October and early November more than 300 people died within two weeks in Macedonia and Thrace, with 85% to 87% of them unvaccinated. It does not follow from this that all of Northern Greece had uniformly low coverage, nor can any part of the national outcome be attributed quantitatively to these areas.
The second is timing: the booster dose began after the autumn 2021 wave had already started. Correlation is not causation; waves are also shaped by variants, seasonality, age structure and behaviour.
Documentation for the regional figures: Northern Greece, vaccination coverage and the autumn 2021 wave (eKathimerini, covid19.gov.gr).
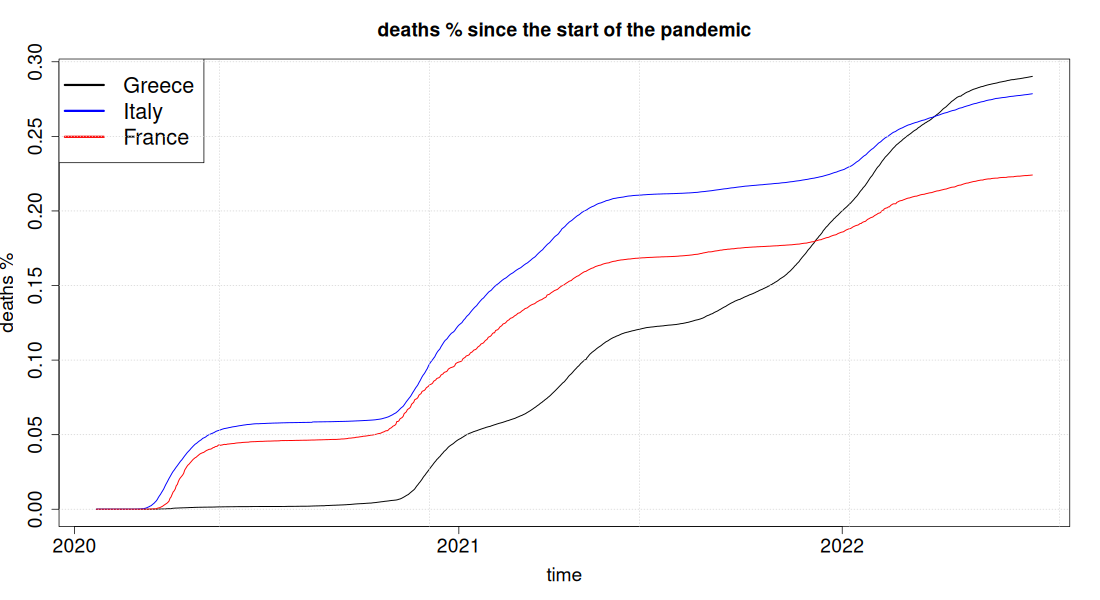
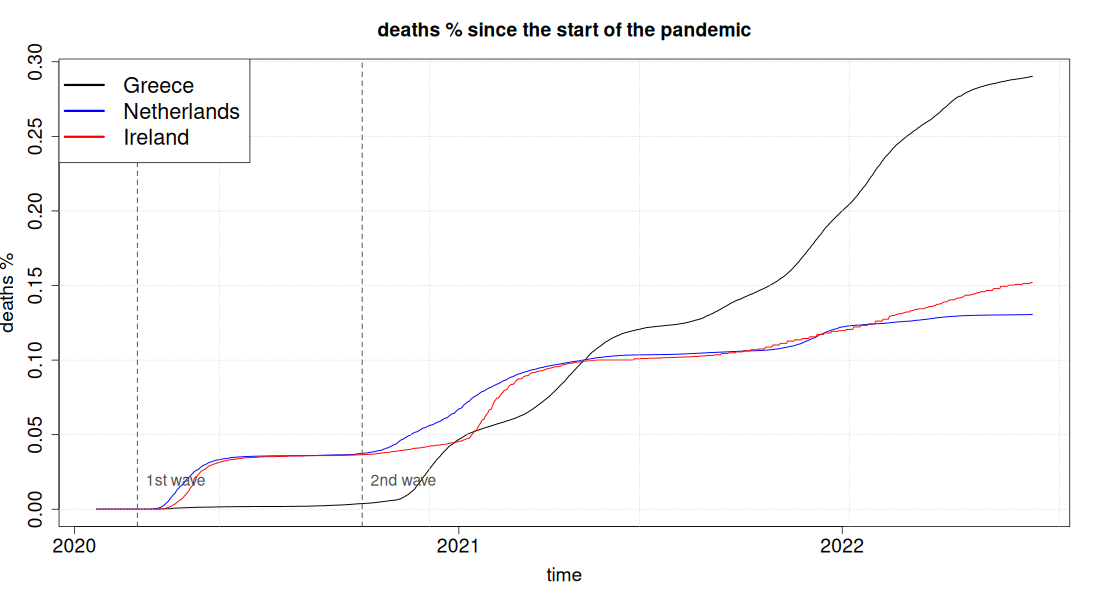
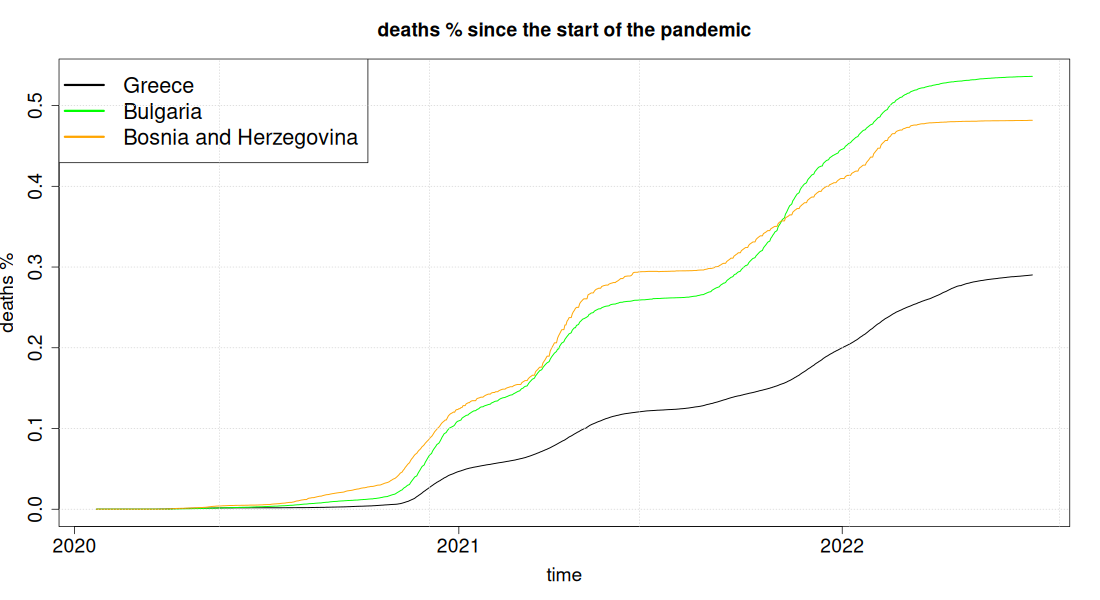
What makes the Greek case even more remarkable is where it started from. Greece came through the first wave almost untouched: at the start of the second wave, on 1 October 2020, it counted 38 deaths per million inhabitants, fewer than any other country in the study, when the United Kingdom was at 867, Belgium at 865, Spain at 684, Italy at 594, Sweden at 584, France at 487, the Netherlands at 375 and Ireland at 366. It had, in other words, an indisputable seven-month head start, with very few cases and very few deaths, while the other countries had already paid a heavy price.
By the end of the period, on 1 July 2022, the picture has been reversed. With 2,902 deaths per million inhabitants Greece stands above most of the countries in the study, having overtaken France (2,241), Belgium (2,754), Italy (2,786), Sweden (1,894), Ireland (1,519) and the Netherlands (1,306), countries that at the start of the second wave had 10 to 23 times more deaths per inhabitant than it did. The reversal fits into a single number: cumulative Greek deaths multiplied by 77 within twenty-one months, while those of these countries multiplied by only 3 to 5. The most extreme reversal is with the Netherlands: it began the second wave with ten times more deaths than Greece and finished with less than half, even though it recorded more cases (47.8% of its population against 35.4%). The difference also survives the excess mortality check, which does not depend on definitions: 1,803 additional deaths per million for the Netherlands, 3,145 for Greece. The seven-month head start was not merely lost, it turned into a shortfall.
| Country | Deaths multiplied by 1 Oct 2020 → 1 Jul 2022 |
|---|---|
| Greece | ×77.0 |
| Italy | ×4.7 |
| France | ×4.6 |
| Ireland | ×4.2 |
| Netherlands | ×3.5 |
| United Kingdom | ×3.4 |
| Spain | ×3.4 |
| Sweden | ×3.2 |
| Belgium | ×3.2 |
A detailed presentation for all countries, with absolute numbers and excess mortality: Deaths
Sweden deserves a special mention: it never applied a general lockdown comparable to the Greek ones and ended up with 65% of the Greek deaths per inhabitant. The comparison does not on its own prove anything about the effectiveness of the measures: the two countries differ in age structure, household composition, elderly care and health system. It does show, however, that the final outcome cannot be read off the strictness of the restrictions, and that the Greek result is explained neither by the intensity of the measures nor by vaccination coverage.
In detail: Deaths & Vaccination · ICU: beds and staff
The parts of the article
The article consists of this page and seven more pages with the charts and the detailed figures on which the above rests.
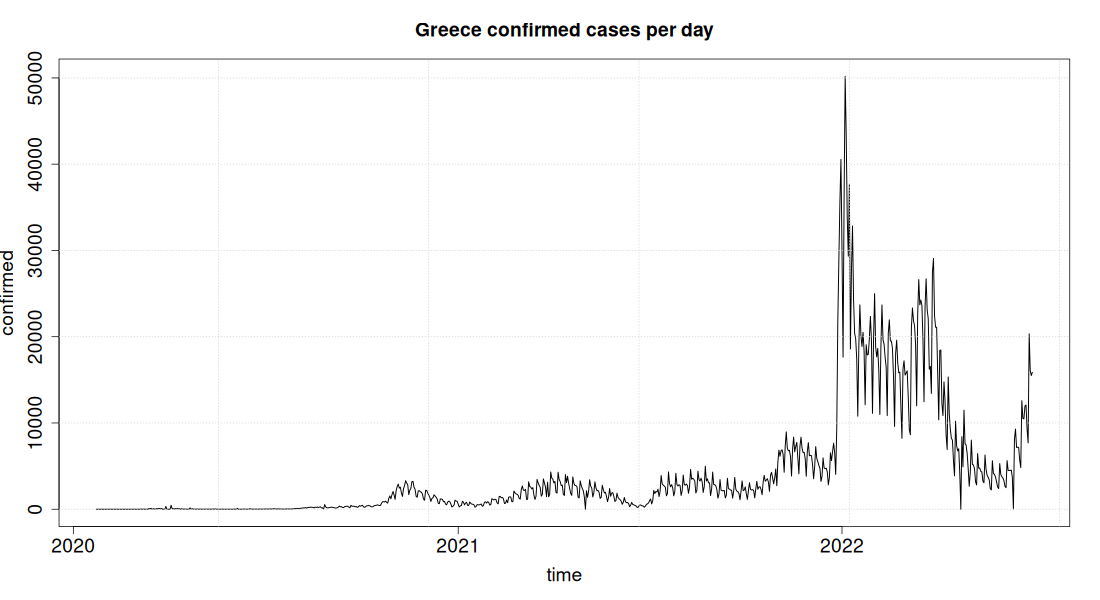
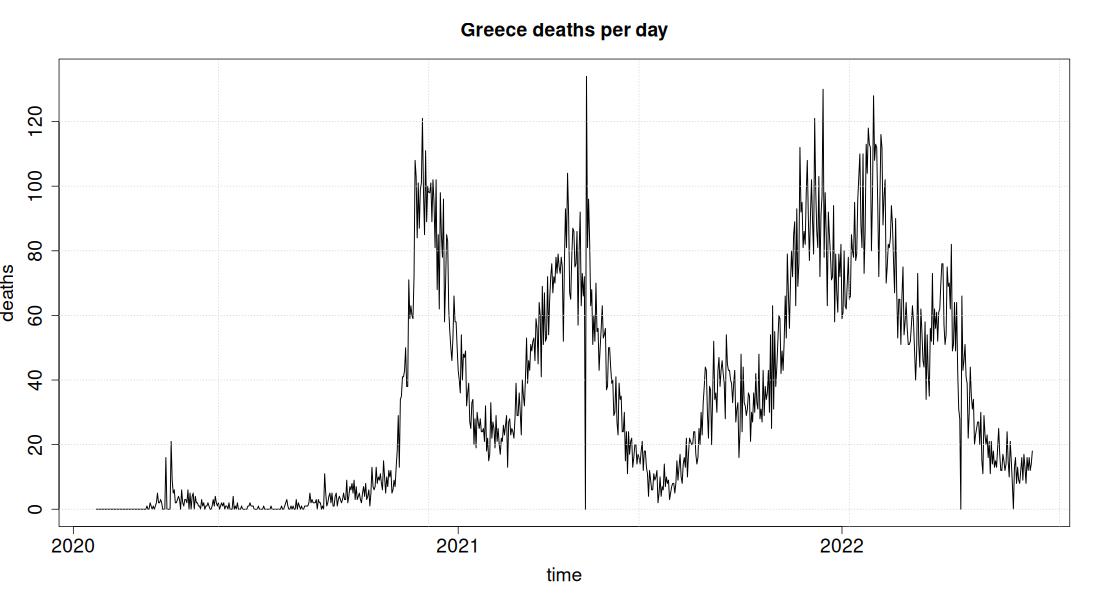
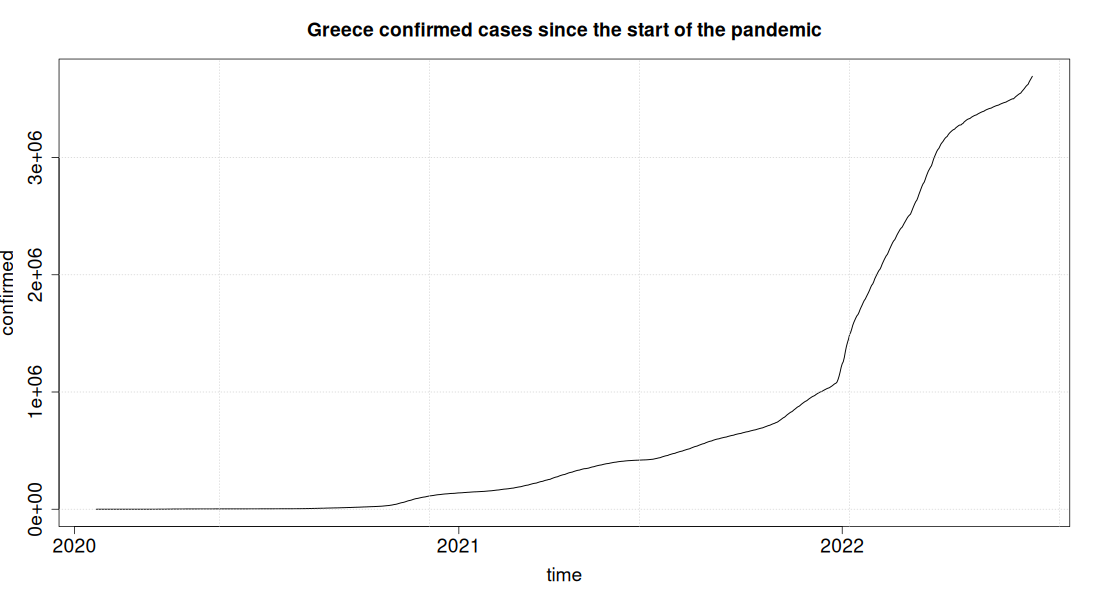
- Greece – the general presentation of the pandemic statistics for Greece: cases and deaths, daily and weekly, with no comparison to other countries.
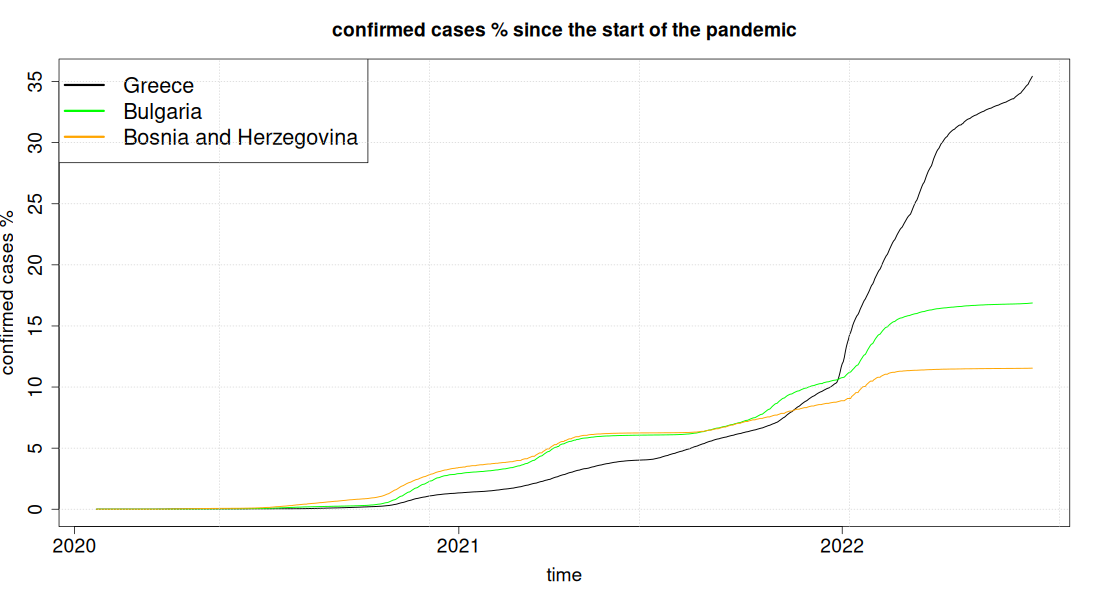
- Confirmed cases – how many people were infected in each country as a percentage of the population. It supports the argument that Greece did not have more infections than France.
- Deaths – the reversal of the Greek position from 2020 to 2022, with the absolute numbers and the excess mortality that answers the objection about different recording.
- Fatality rate – deaths per recorded case. It shows the Greek shortfall without depending on hospitalisation decisions; it does depend on the intensity of testing, though, and the page explains how to read it.
- Deaths & Vaccination – the 60+ vaccination coverage set against deaths after vaccination. Here it becomes clear that coverage does not explain Greece.
- ICU: beds and staff – beds, nurses and deaths per admission. The page on which the understaffing explanation rests.
- A note on method – how the measures were chosen, why everything is scaled to population, and what these data cannot show.
Data
The analysis covers the period up to 1 Jul 2022. It stops there because Greece then moved to weekly, batched reporting, which is not comparable with what came before.
Files last updated: 2026-07-23 11:00:56+0000
- Cases and deaths: JHU CSSE
- Vaccination and excess mortality: Our World in Data
- Vaccination 60+, hospital and ICU admissions: ECDC
- ICU beds and nursing staff: Eurostat (and national sources, on the ICU page)
- Analysis code: github.com/maisk/covid19-greece-stats
Leave a comment
Comments are moderated, and appear with the site's next update.