
The data cover the period up to 1 Jul 2022. The analysis stops there because Greece then moved to weekly, batched reporting, which is not comparable with what came before.
Confirmed Cases: confirmed cases as a percentage of each country's population
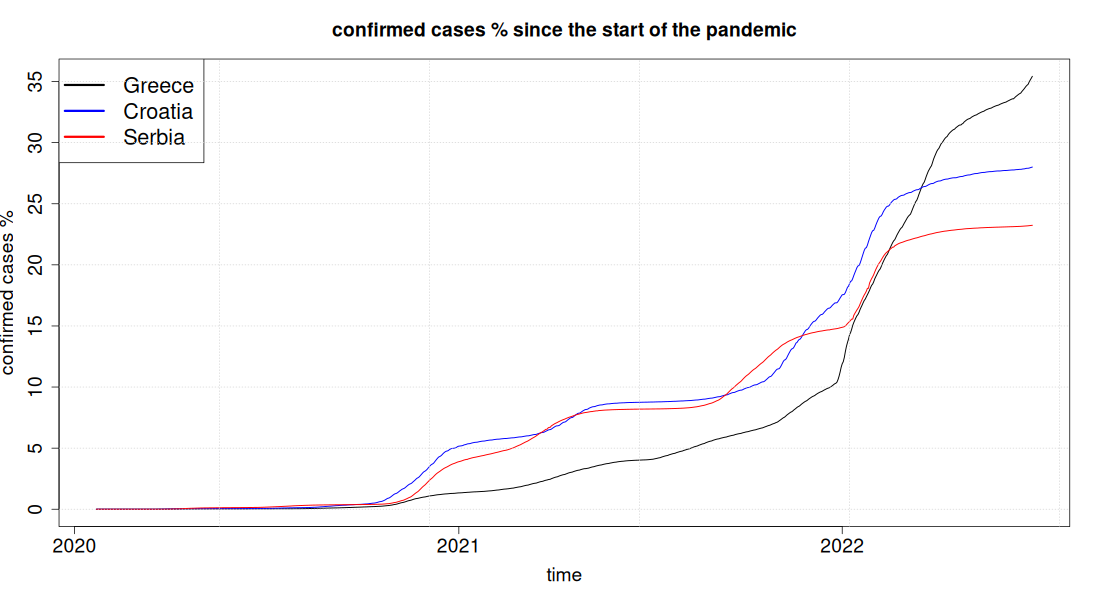
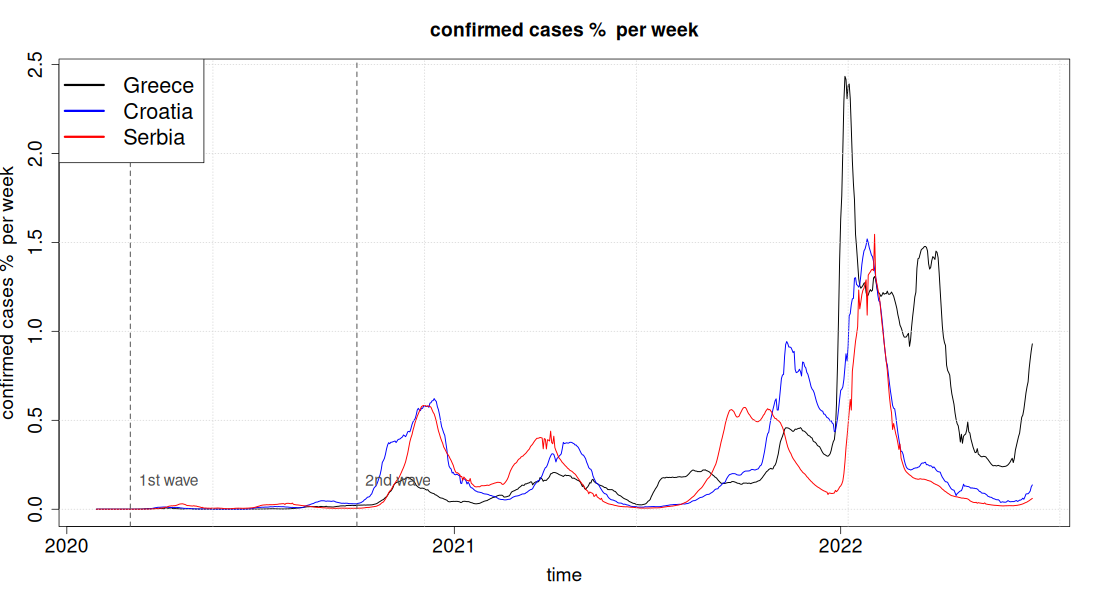
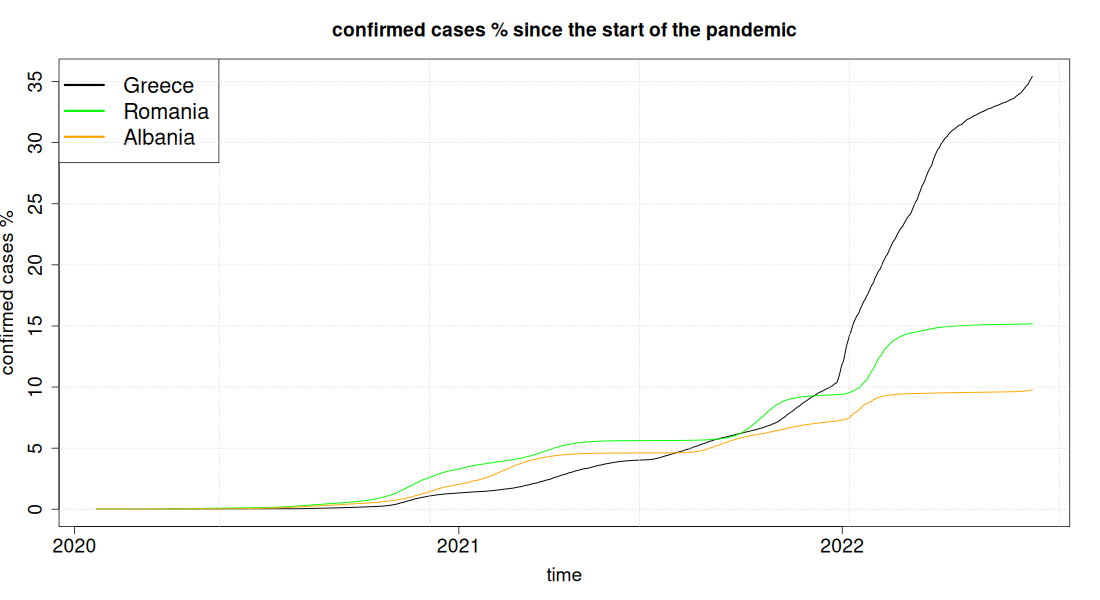
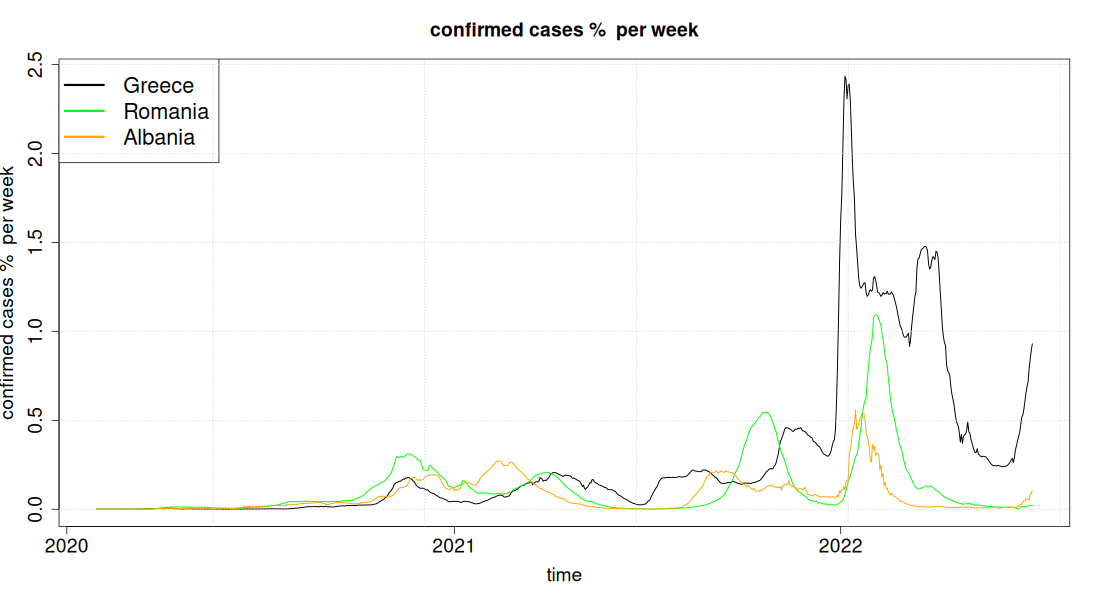
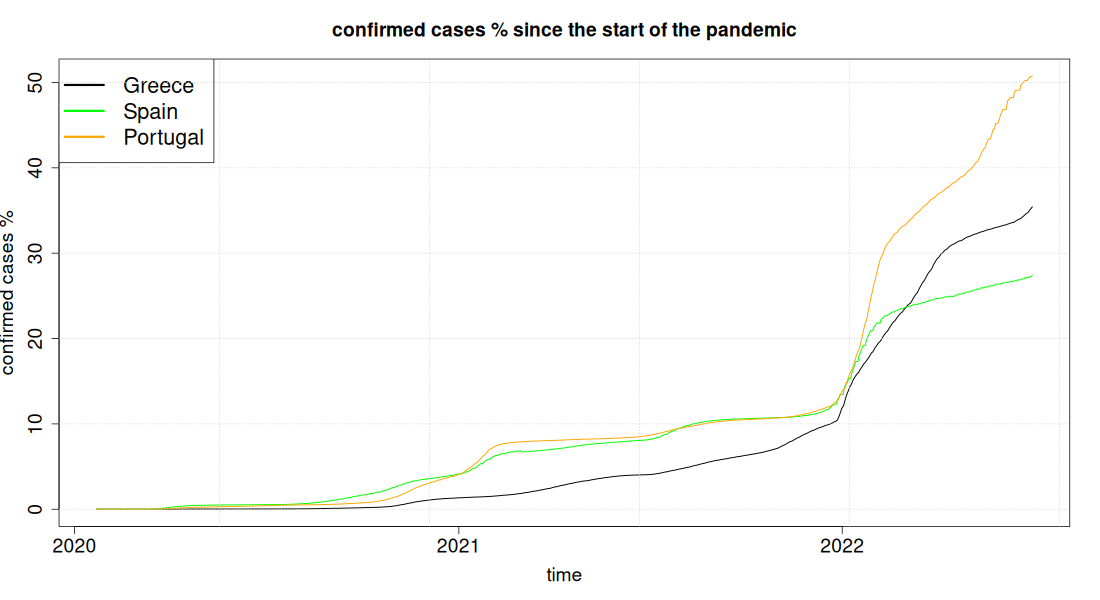
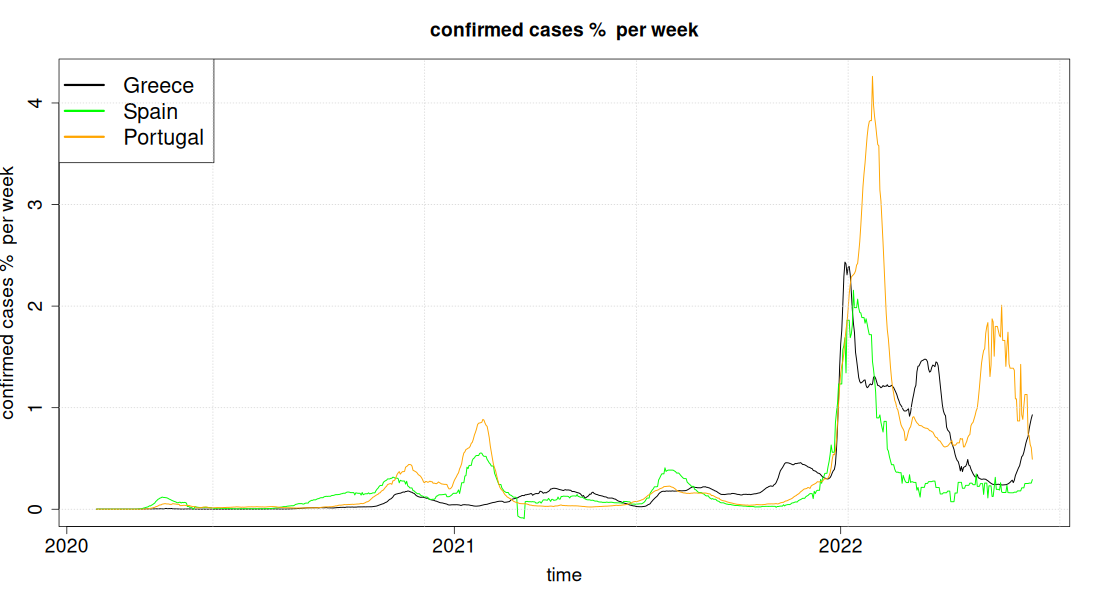
Each section has two charts for the same countries. The first is cumulative, that is at each date it shows total cases since the start of the pandemic, and for that reason it always rises; there you can read which country overtakes which, and when. The second shows the new cases of each week, and there you read the waves: when they arrived in each country and how high they went. In both, the vertical axis is a percentage of each country's population, so that countries of very different size can be compared.
The basic caveat in any comparison of cases is that what is being compared is not infections but records: a country that does more testing finds more cases, even with the same spread. The differences between these curves should not be read as an exact difference in how many people fell ill. This does not undo the conclusion that follows, though, because there Greece appears with fewer recorded cases and more deaths: under-recording would make the gap larger, not smaller.
The two vertical dashed lines mark the start of the 1st wave (March 2020) and of the 2nd (October 2020). There is no official definition of a "wave": neither the WHO nor the ECDC has set dates, so these points are conventional and were chosen to fit the data.
Greece essentially avoided the first wave, and did so more than any other country in the comparison. Up to 30/6/2020 it had 18 deaths and 327 cases per million inhabitants, the fewest of all fifteen countries that appear in these pages (Italy, France, Spain, Portugal, Sweden, the United Kingdom, Belgium, the Netherlands, Ireland, Croatia, Serbia, Bulgaria, Bosnia and Herzegovina, Romania, Albania). For comparison: Belgium 841, the United Kingdom 828, Spain 615, Italy 575, Sweden 528, France 456 deaths per million.
In the cumulative charts this appears as a low, almost flat Greek line until the autumn of 2020: Greece enters the 2nd wave having recorded just 1,812 cases per million inhabitants, the fewest in the sample. The country therefore started from an advantageous position and then lost it; that is why the Greek curves later overtake countries that in the first wave stood far higher.
| Country | Cases per million at the start of the 2nd wave (1 Oct 2020) | Cases per million at the end of the period (1 Jul 2022) |
|---|---|---|
| Greece | 1,812 | 354,250 |
| Bulgaria | 2,998 | 168,783 |
| Serbia | 3,853 | 232,377 |
| Croatia | 4,099 | 280,024 |
| Albania | 4,797 | 97,807 |
| Italy | 5,250 | 307,798 |
| Romania | 6,740 | 151,757 |
| United Kingdom | 6,779 | 334,989 |
| Ireland | 7,412 | 324,156 |
| Netherlands | 7,466 | 477,982 |
| Portugal | 7,492 | 507,148 |
| Bosnia and Herzegovina | 8,458 | 115,458 |
| France | 9,066 | 464,838 |
| Sweden | 9,269 | 249,444 |
| Belgium | 10,445 | 366,369 |
| Spain | 16,653 | 274,158 |
Click a column heading to sort the table.
Greece, Italy, France
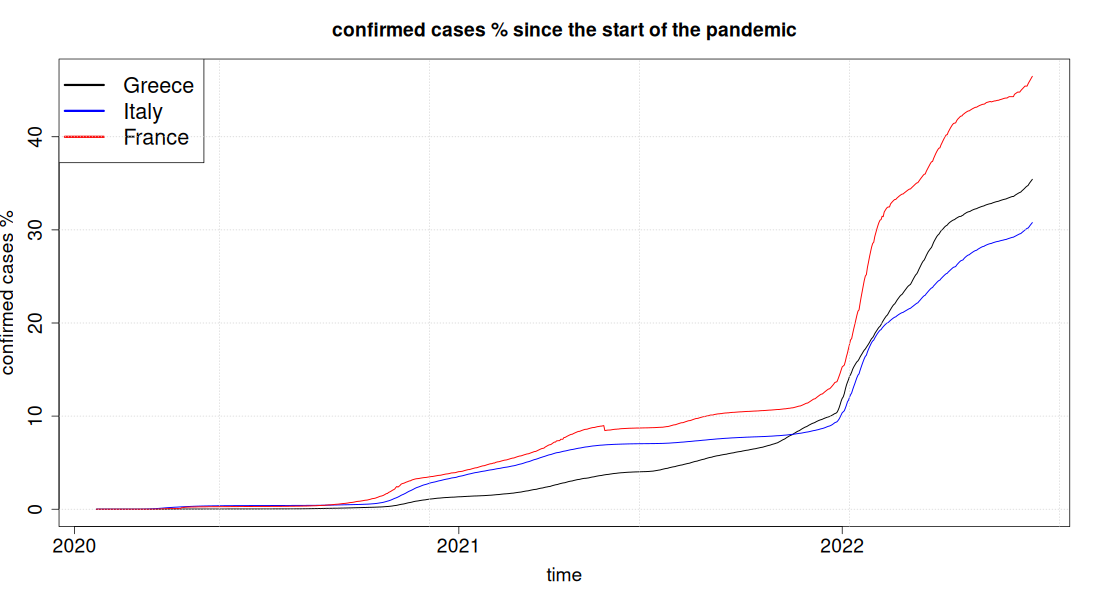
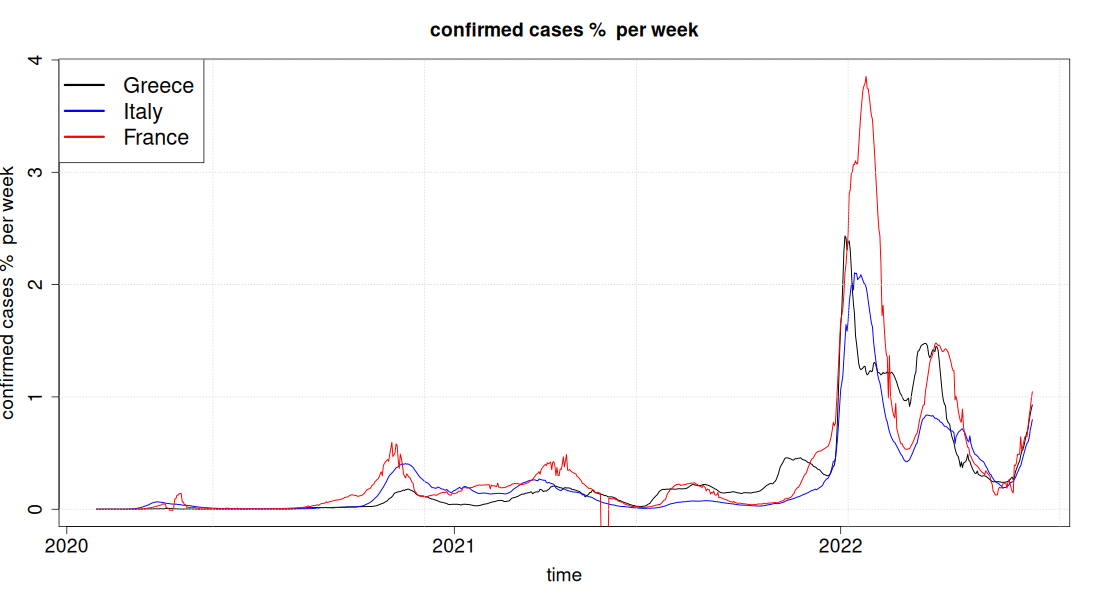
The article's central comparison. Greece ends up with 354,000 cases per million inhabitants, while France reaches 465,000 and Italy 308,000: Greece recorded fewer cases than France and roughly as many as Italy. In deaths, however, it has 2,902 per million, against 2,241 for France and 2,786 for Italy. The difference, then, is not born here, in how many people were infected.
Greece, Sweden, United Kingdom (UK)
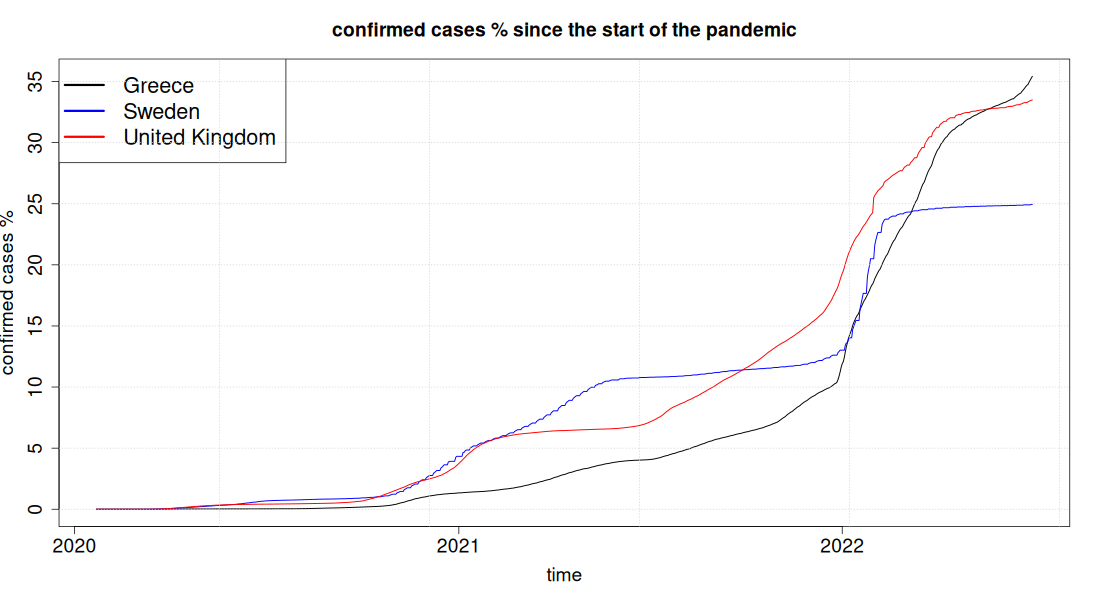
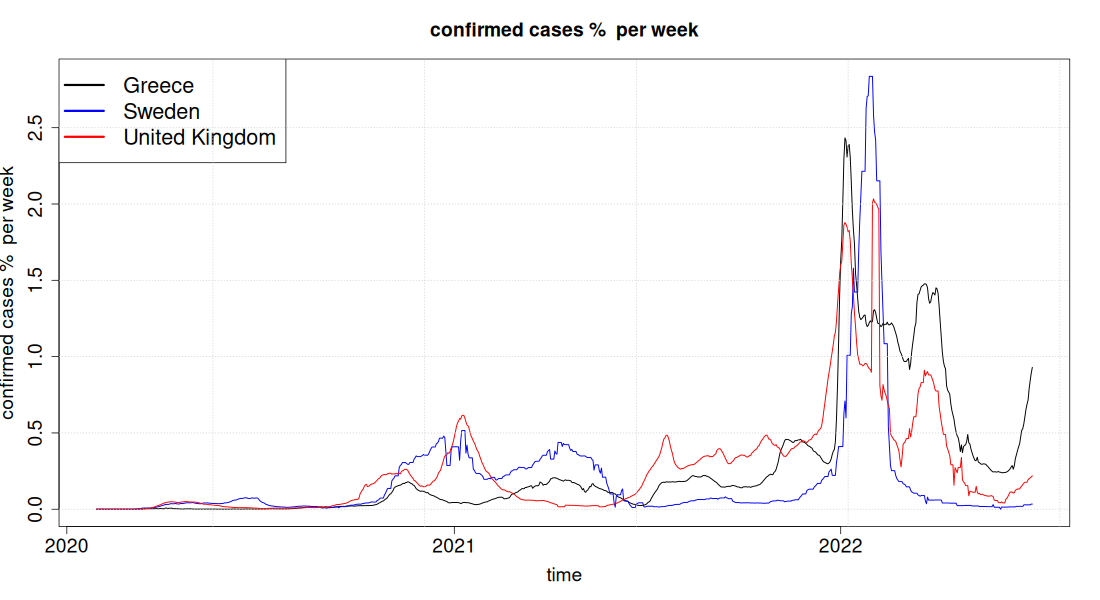
Sweden never applied a general lockdown comparable to the Greek ones, and the United Kingdom entered the first wave with the most deaths in the sample. Both end up with fewer or roughly the same cases per inhabitant as Greece (249,000 for Sweden, 335,000 for the United Kingdom, 354,000 for Greece) but with fewer deaths in Sweden's case, 1,894 per million against 2,902. The two countries differ in many things, from age structure to household composition, so the comparison proves nothing about the measures; it does show, however, that the final outcome cannot be read off their strictness.
Greece, Croatia, Serbia
Greece, Bulgaria, Bosnia and Herzegovina
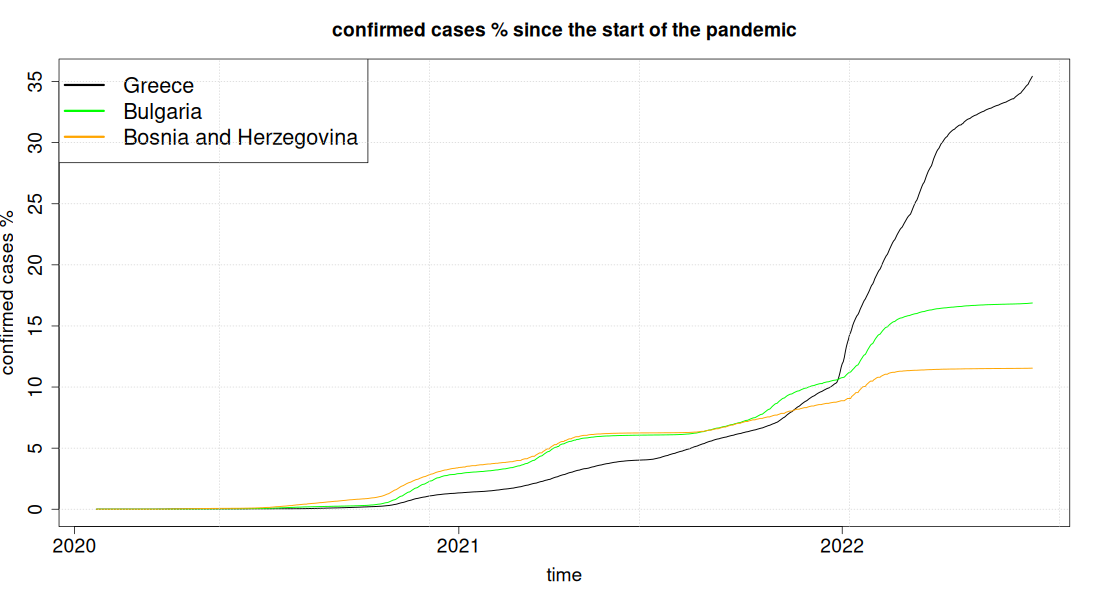
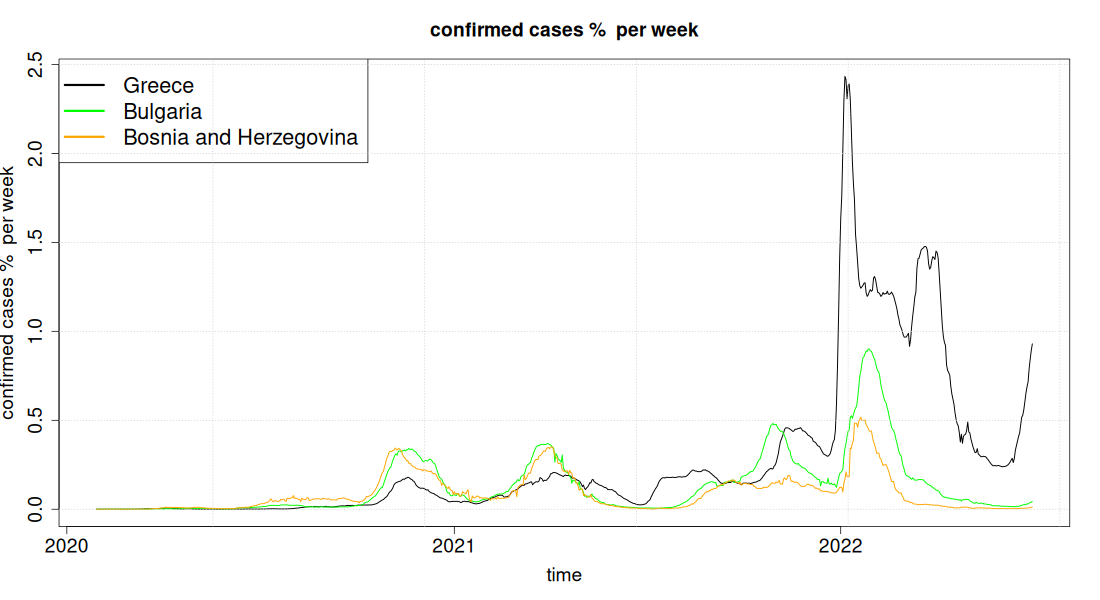
Here the caveat about testing is the most serious on the whole page, and the low curves should not be read as less spread. Bulgaria and Bosnia and Herzegovina show 169,000 and 115,000 cases per million inhabitants, a third of the Greek figure, yet they have 5,362 and 4,818 deaths per million against 2,902 for Greece. With fewer recorded cases and far more deaths, the likeliest explanation is that they were detecting a smaller share of infections, not that they had fewer.
Greece, Albania, Romania
Greece, Spain, Portugal
Greece, Netherlands, Ireland
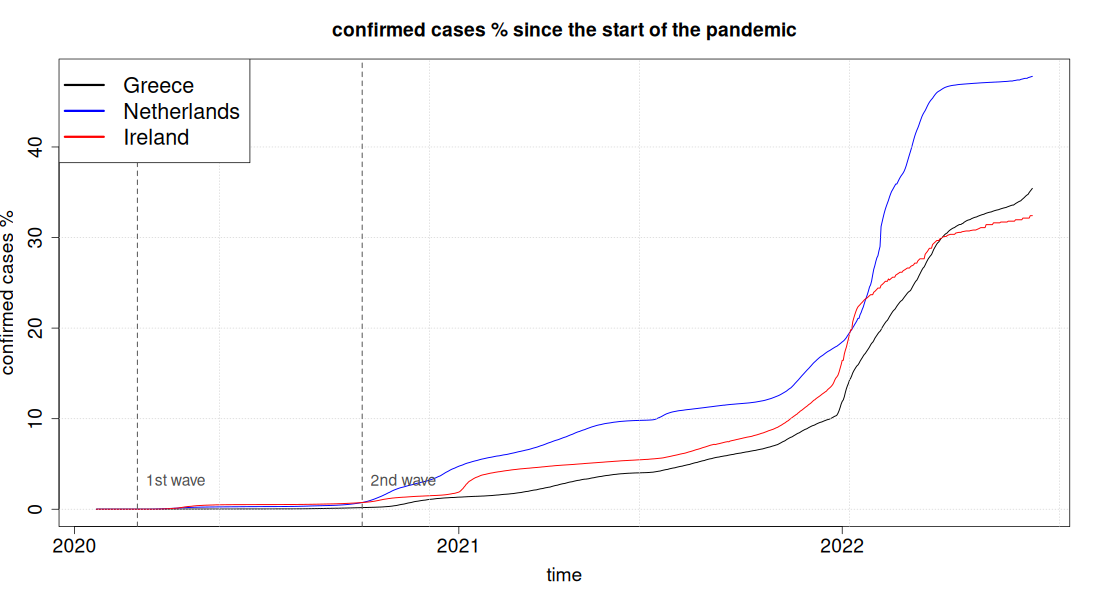
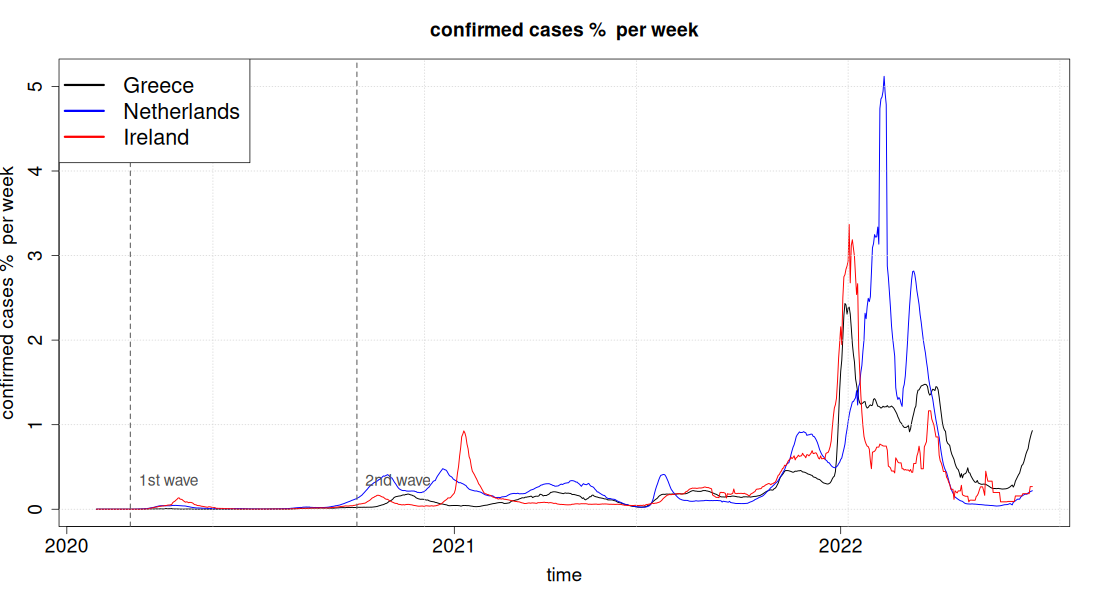
This comparison shows that the Greek problem was not the number of infections. The Netherlands recorded 478,000 cases per million inhabitants against 354,000 for Greece, that is almost half its population against one third, and Ireland 324,000, slightly fewer than Greece. In deaths, however, Greece has 2,902 per million, Ireland 1,519 and the Netherlands 1,306.
Leave a comment
Comments are moderated, and appear with the site's next update.