
The data cover the period up to 1 Jul 2022. The analysis stops there because Greece then moved to weekly, batched reporting, which is not comparable with what came before.
Fatality Rate: covid deaths relative to confirmed cases, expressed as a percentage
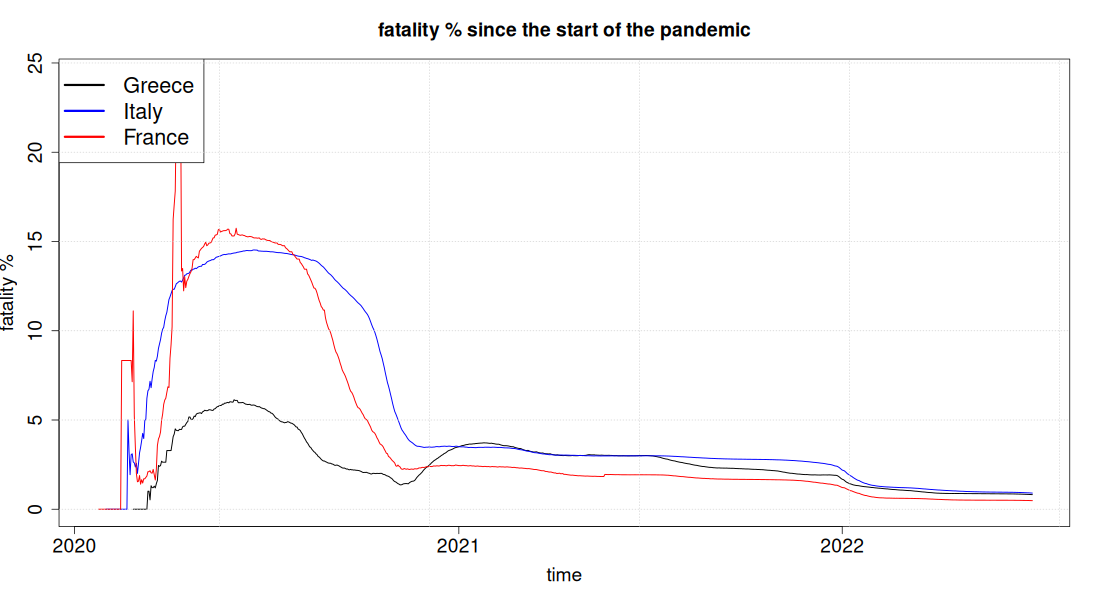
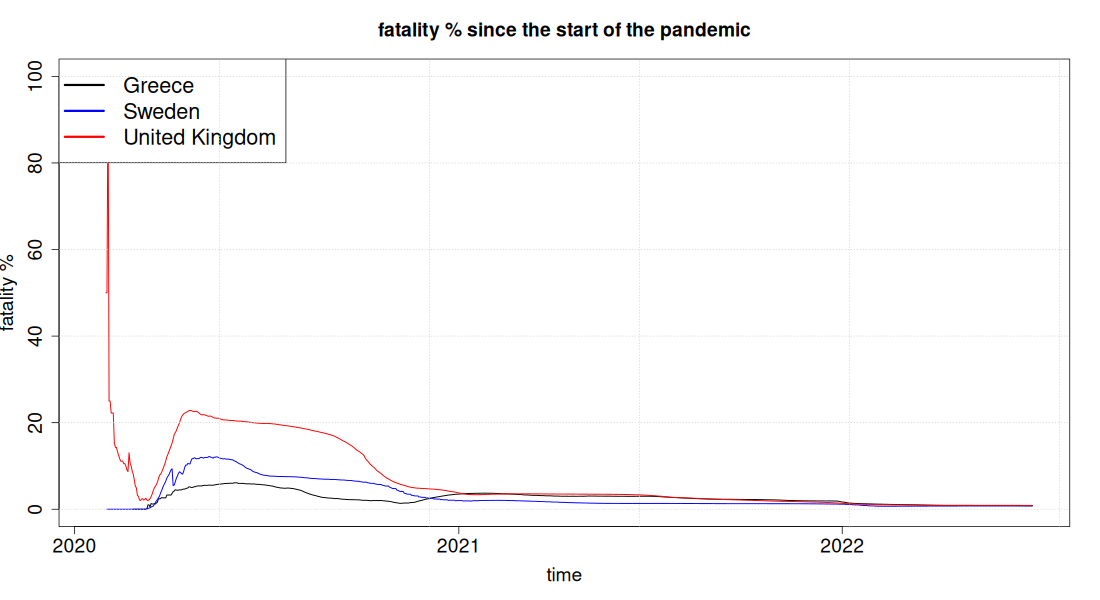
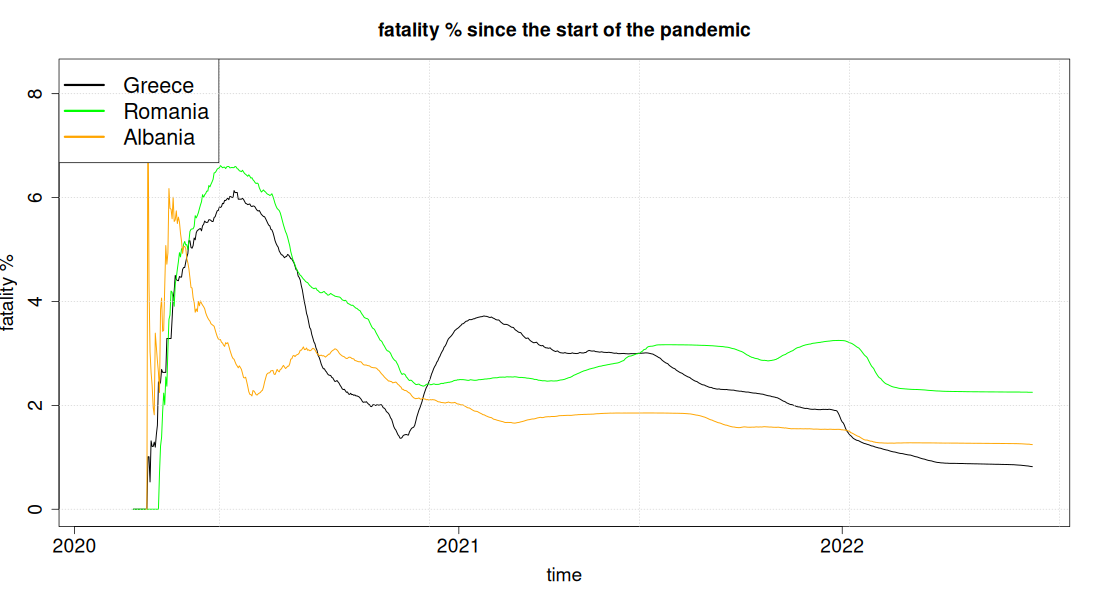
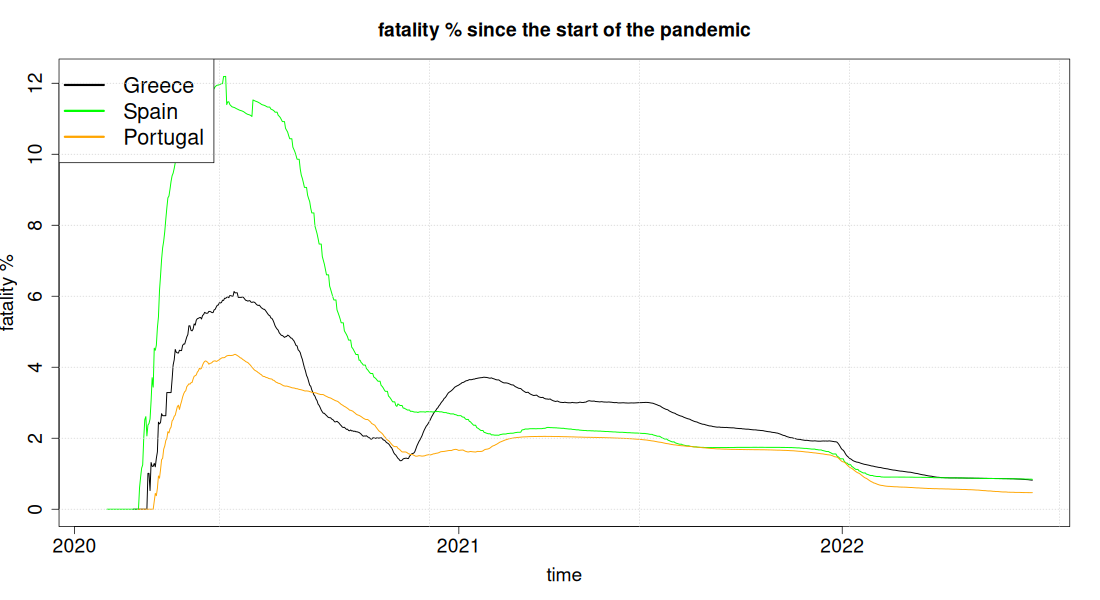
This indicator, known internationally as the case fatality rate, does not measure how lethal the virus is but how lethal the disease was as recorded. The denominator is not those who were infected, it is those who tested positive: two countries with exactly the same spread show different fatality if one tests widely and the other only the serious cases. That is why the absolute values should be read with caution, especially between countries with very different testing policies.
Two more points on reading the charts. The ratio is computed from the cumulative figures, that is at each date it shows total deaths against total cases up to that moment, not the risk on that particular day; as time passes and the denominator grows, the curve moves ever more slowly. And the very high values of the first months everywhere are due to the minimal testing of spring 2020, not to a more lethal disease. The evolution of the indicator over time, with a rolling window instead of a cumulative sum, is shown on the page for Greece.
The two vertical dashed lines mark the start of the 1st wave (March 2020) and of the 2nd (October 2020). There is no official definition of a "wave": neither the WHO nor the ECDC has set dates, so these points are conventional and were chosen to fit the data.
Greece essentially avoided the first wave, and did so more than any other country in the comparison. Up to 30/6/2020 it had 18 deaths and 327 cases per million inhabitants, the fewest of all fifteen countries that appear in these pages (Italy, France, Spain, Portugal, Sweden, the United Kingdom, Belgium, the Netherlands, Ireland, Croatia, Serbia, Bulgaria, Bosnia and Herzegovina, Romania, Albania). For comparison: Belgium 841, the United Kingdom 828, Spain 615, Italy 575, Sweden 528, France 456 deaths per million.
In the charts this appears as a Greek curve that starts low and rises steadily after the autumn of 2020, while the countries that had paid a heavy price in the first wave come down as tests and recorded cases multiply.
Greece, Italy, France
Greece, Sweden, United Kingdom (UK)
Greece, Croatia, Serbia
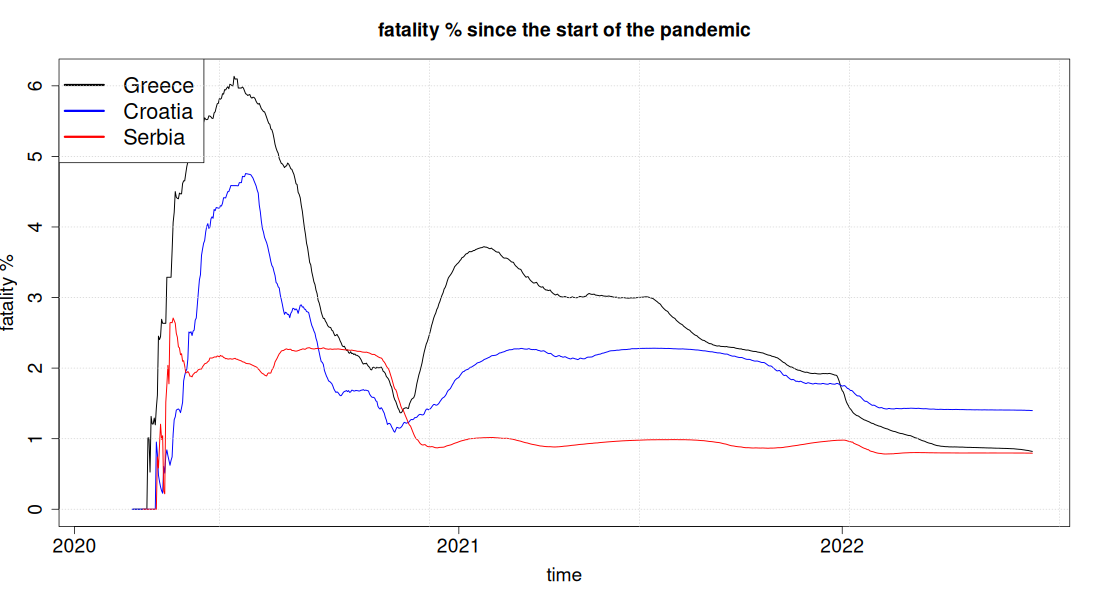
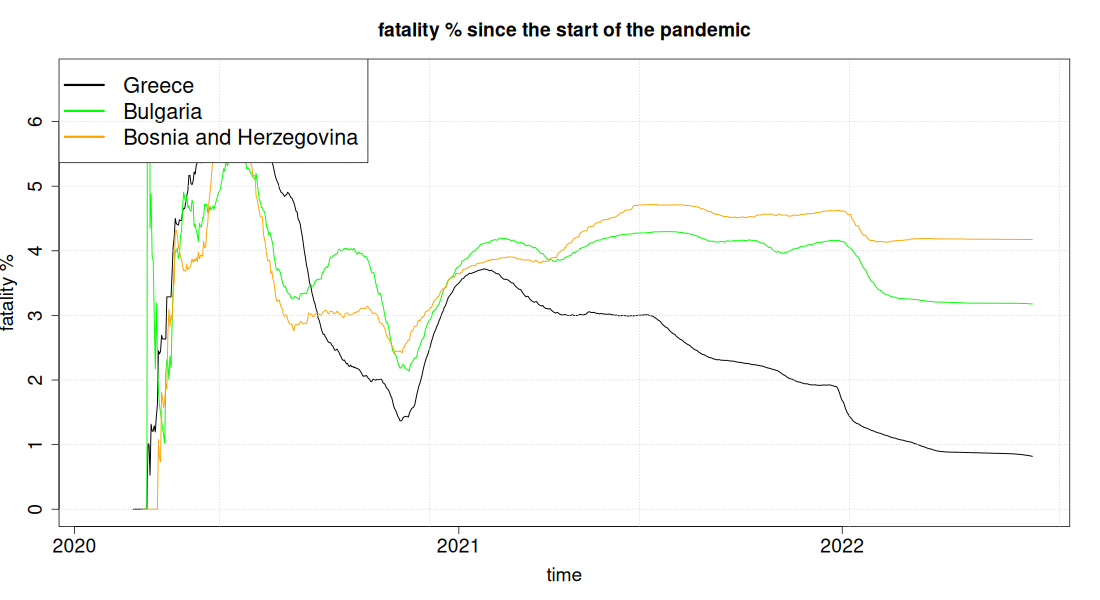
In this section and the two that follow, with the Balkan countries, the chart shows the opposite of reality and should not be read like the rest. Serbia appears with a fatality of 0.79% and Albania with 1.24%, that is lower than or comparable to the 0.82% of Greece. If, however, excess mortality is put in place of recorded COVID deaths, the same quantities become 3.49% for Serbia and 5.82% for Albania, while Greece barely moves, to 0.89%.
The distortion here is twofold, because the indicator has a problem in both of its terms: deaths are under-recorded in the numerator and a smaller share of infections is detected in the denominator, because of the lower testing. The two effects run in opposite directions and do not cancel each other out in any predictable way. The table at the end of the page gives both measures side by side for each country.
Greece, Bulgaria, Bosnia and Herzegovina
Greece, Albania, Romania
Greece, Spain, Portugal
Greece, Netherlands, Ireland
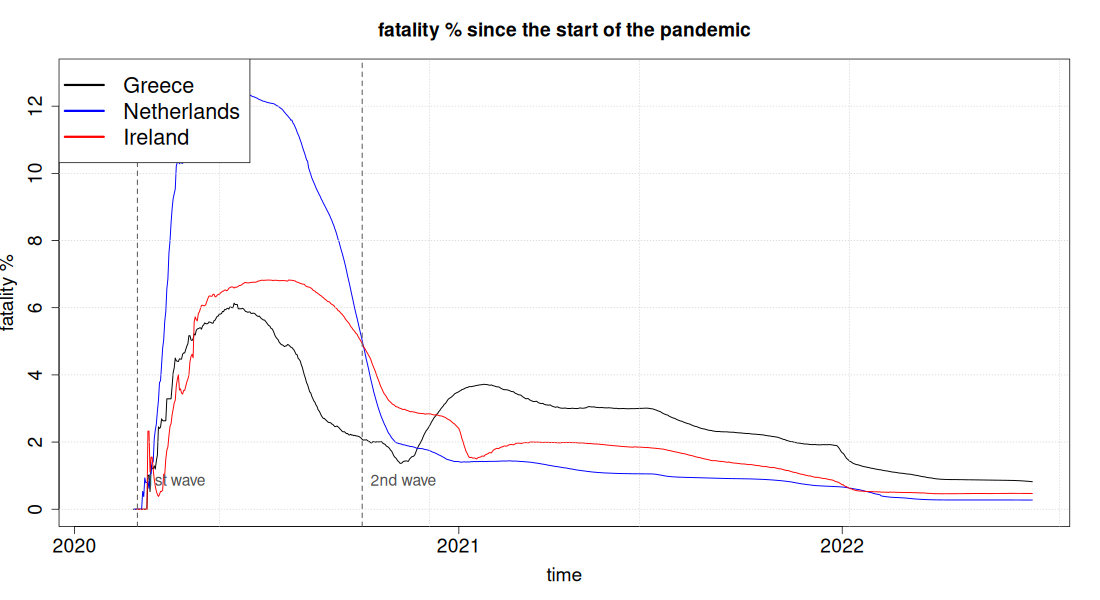
In the comparison with the Netherlands and Ireland the difference is clear: 0.82% fatality per recorded case for Greece, 0.47% for Ireland, 0.27% for the Netherlands. On the basis of excess mortality, which does not depend on definitions, the corresponding figures are 0.89%, 0.31% and 0.38%. By both measures, for every recorded infection in Greece two to three times more people died.
The same quantity by two measures. The first column is fatality as it results from recorded COVID deaths, the one shown in the charts. The second replaces recorded deaths with excess mortality, that is with the real additional deaths of the period compared with what was expected on the basis of 2015-2019. The ratio of the two shows how reliable each country's official recording is.
| Country | Fatality from recorded COVID deaths | Fatality from excess mortality | Ratio |
|---|---|---|---|
| Bosnia and Herzegovina | 4.17% | 5.93% | 1.42 |
| Bulgaria | 3.18% | 5.86% | 1.84 |
| Albania | 1.24% | 5.82% | 4.68 |
| Romania | 2.25% | 3.85% | 1.71 |
| Serbia | 0.79% | 3.49% | 4.40 |
| Croatia | 1.40% | 1.79% | 1.28 |
| Italy | 0.91% | 1.07% | 1.18 |
| Greece | 0.82% | 0.89% | 1.08 |
| Spain | 0.84% | 0.84% | 1.00 |
| United Kingdom | 0.88% | 0.63% | 0.71 |
| Belgium | 0.75% | 0.52% | 0.70 |
| Portugal | 0.47% | 0.46% | 0.98 |
| Sweden | 0.76% | 0.41% | 0.55 |
| Netherlands | 0.27% | 0.38% | 1.38 |
| Ireland | 0.47% | 0.31% | 0.67 |
| France | 0.48% | 0.30% | 0.63 |
Click a column heading to sort the table.
The ranking changes dramatically. With the official figures Serbia shows a fatality of 0.79% and Albania 1.24%, that is lower than or comparable to that of Greece; with excess mortality they shoot up to 3.49% and 5.82%. Greece barely moves, from 0.82% to 0.89%, while France, Sweden, Belgium and the United Kingdom move downwards.
Two caveats. Excess mortality also includes deaths not caused directly by the virus but by the conditions of the pandemic, such as postponed care; for that reason it is not simply "the correct number of COVID deaths". And the denominator remains recorded cases, which depend on the intensity of testing: a country that tests little shows artificially high fatality.
Leave a comment
Comments are moderated, and appear with the site's next update.