
The data cover the period up to 1 Jul 2022. The analysis stops there because Greece then moved to weekly, batched reporting, which is not comparable with what came before.
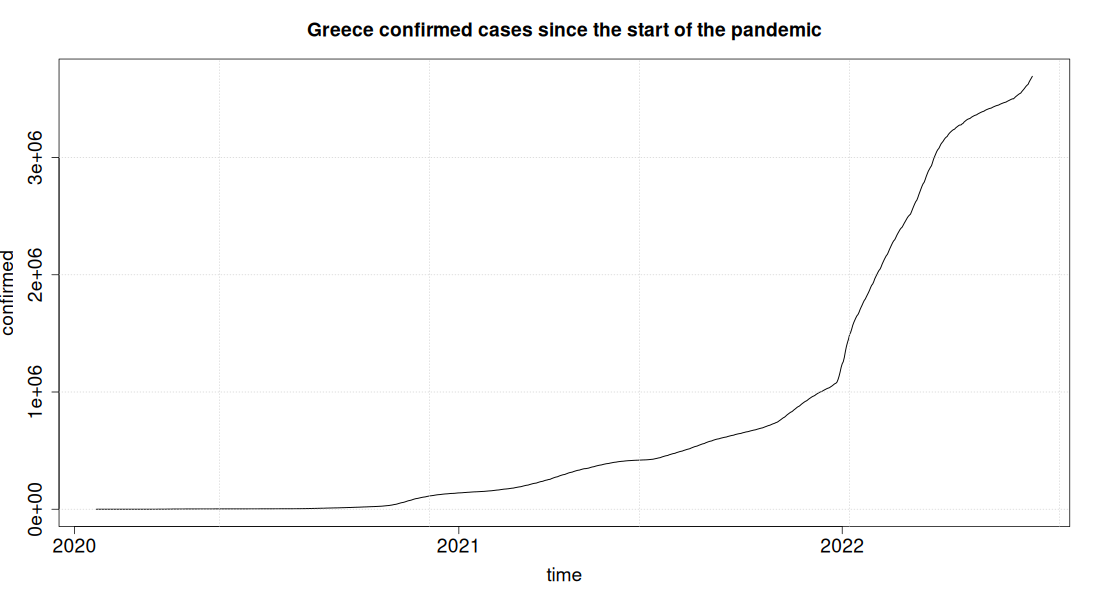
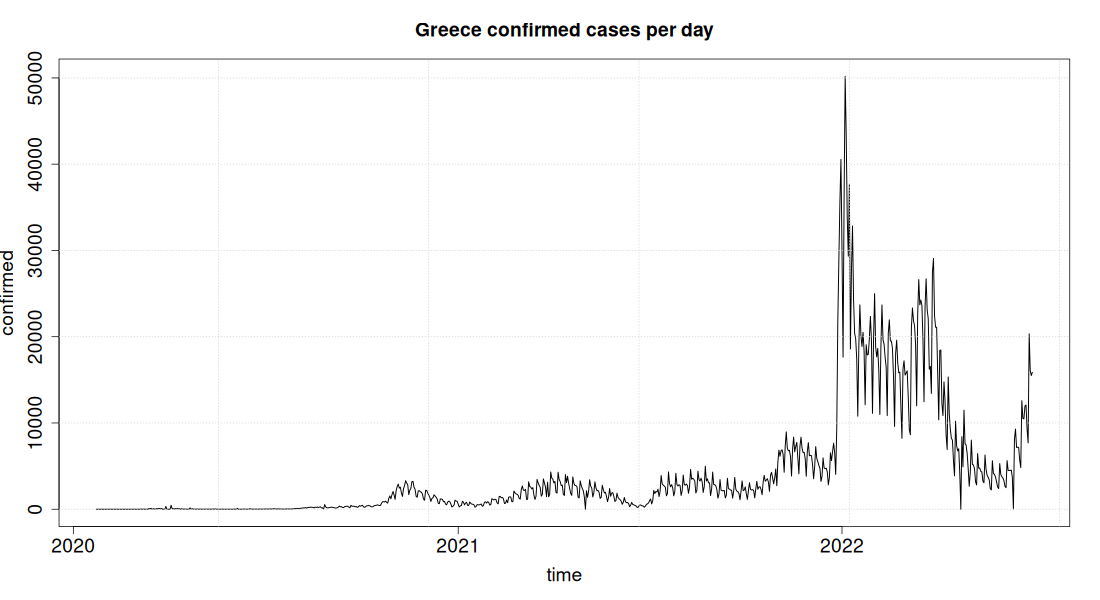
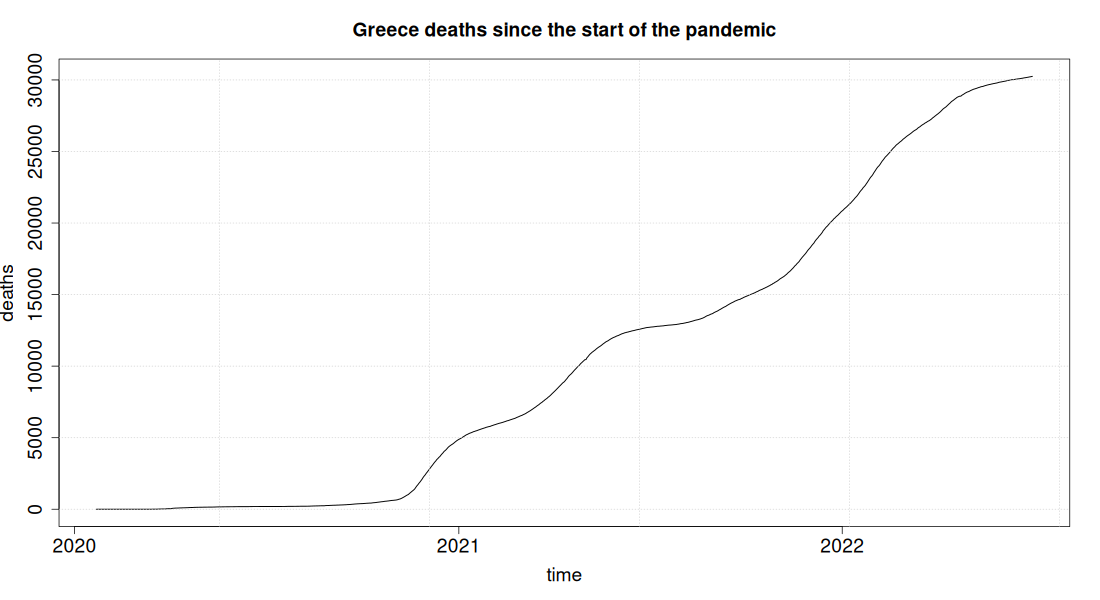
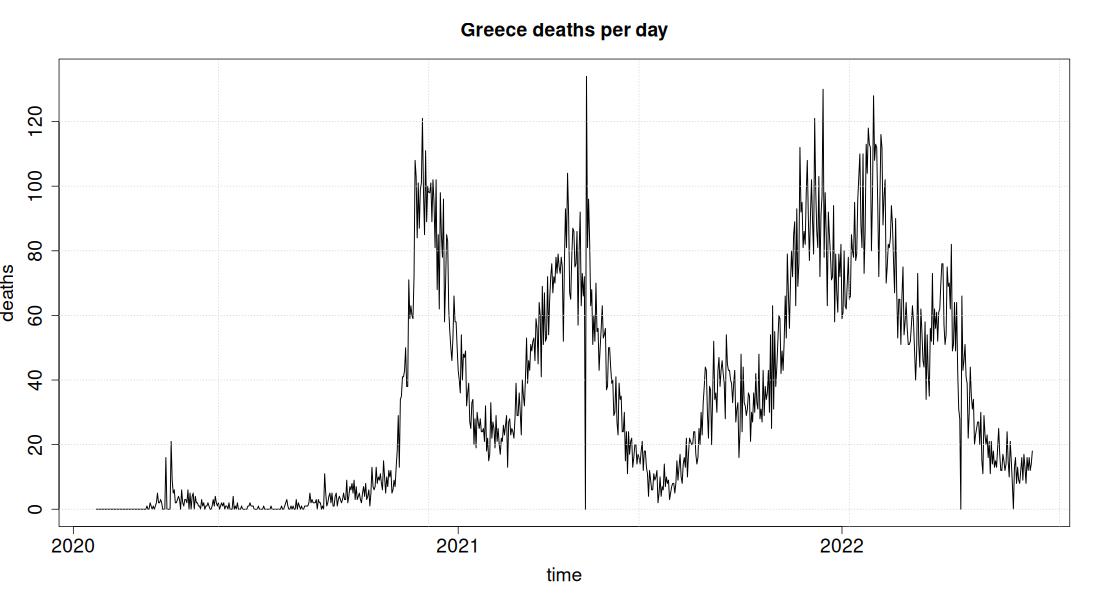
This page shows Greece alone, with no comparison to other countries. In each pair of charts the first is cumulative, that is it shows the total since the start of the pandemic, and the second shows the new cases of each day. The cumulative chart shows the overall size, the daily one shows the waves. Clicking a chart opens it at full size.
Since no comparison is made here, the quantities are absolute numbers of people and not percentages of the population, as on the pages that compare countries.
Confirmed Cases
Confirmed cases are those recorded by a test; the real number of infections is larger and depends on how much testing was being done in each period. The cumulative curve always rises, it never falls; the steeper it is, the faster the country was recording cases at that moment.
Deaths
Deaths officially recorded as COVID deaths. In the daily chart the peaks arrive two to four weeks after the peaks in cases, because that is how long it takes from infection to death.
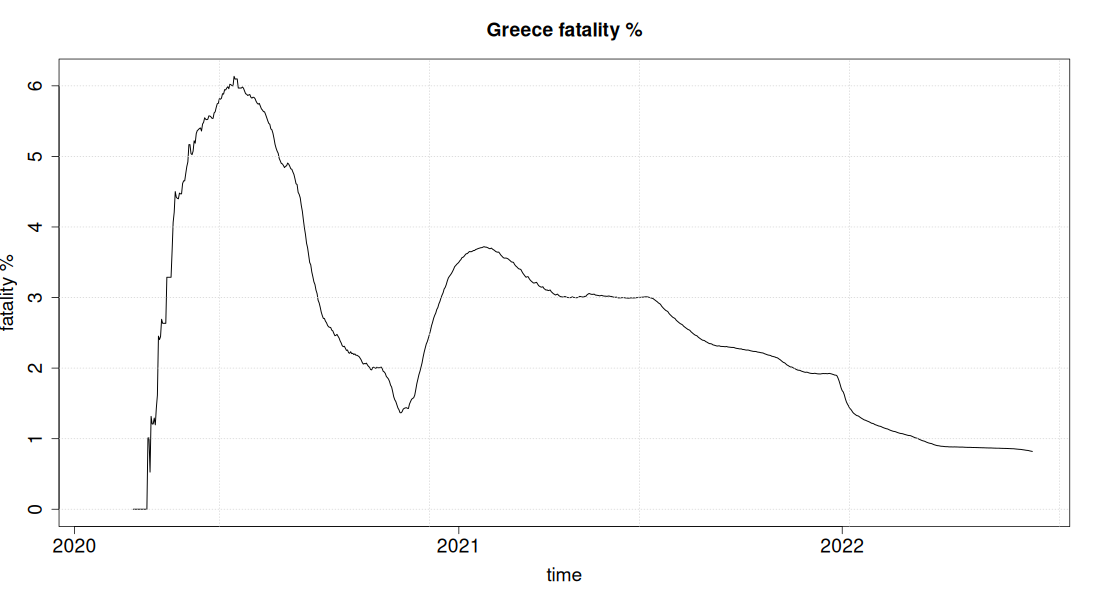
Fatality Rate: ratio of deaths to confirmed covid cases, expressed as a percentage
It is computed from the cumulative figures: at each date it shows total deaths against total cases up to that moment, not the risk on that particular day. The very high values of the first months are due to the minimal testing of spring 2020, not to a more lethal disease.
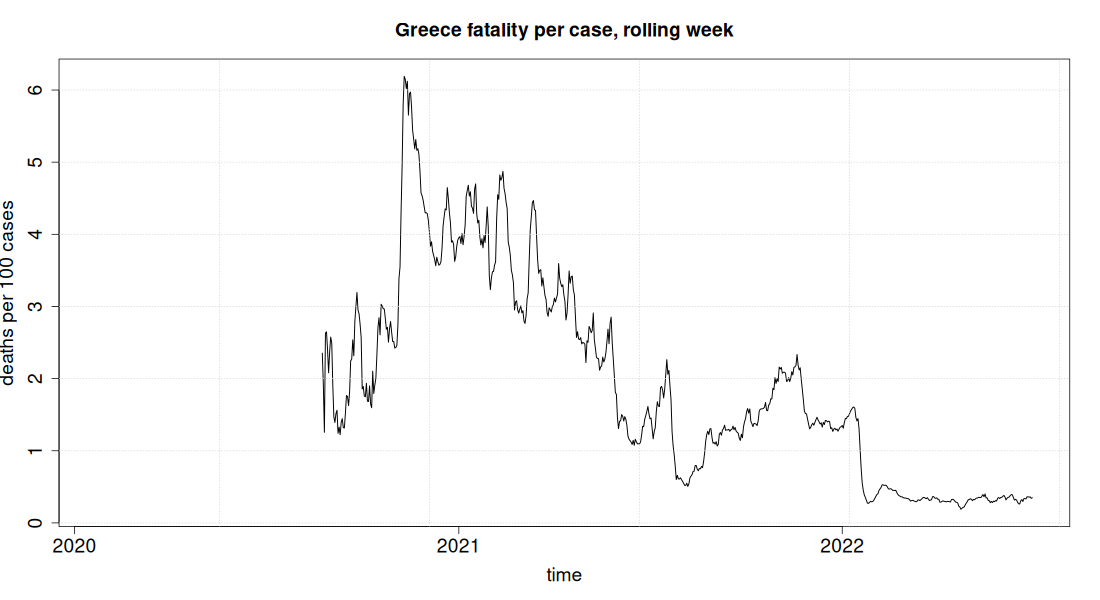
Fatality per case, rolling week
The same quantity, but for the current moment rather than cumulatively: the deaths of each week against the cases of the week that ended three weeks earlier, which is the average interval from the recording of a case to death. This reveals the trend that the cumulative chart hides: a peak of around 6 deaths per 100 cases in the autumn of 2020, a steady decline through 2021 and a fall below 0.5 with the Omicron wave in early 2022.
The curve starts in August 2020 and not at the beginning of the pandemic. In the first months Greece was recording very few cases, from 40 to 300 a week, and at such sizes the ratio measures nothing: one extra death in a week with 40 cases moves the indicator by two and a half points. The first wave of the spring briefly touched 550 cases a week and then cases fell back to double digits for the whole summer. From early August 2020 onwards they stay steadily above a thousand a week, so the ratio becomes meaningful and the line is no longer interrupted. Anything shown before that point would be noise, not lethality.
The basic caveat applies here too: the decline is not due only to better outcomes of the disease, but also to the fact that with mass testing and milder variants far more mild cases were being recorded, that is the denominator was growing.
Leave a comment
Comments are moderated, and appear with the site's next update.