
The data cover the period up to 1 Jul 2022. The analysis stops there because Greece then moved to weekly, batched reporting, which is not comparable with what came before.
The analysis of deaths against vaccination leaves Greece unexplained: its 60+ coverage is essentially the same as France's, yet its post-vaccination mortality is three times higher. This page examines the first candidate explanation, intensive care infrastructure, with Eurostat figures, keeping France as the reference country.
Beds
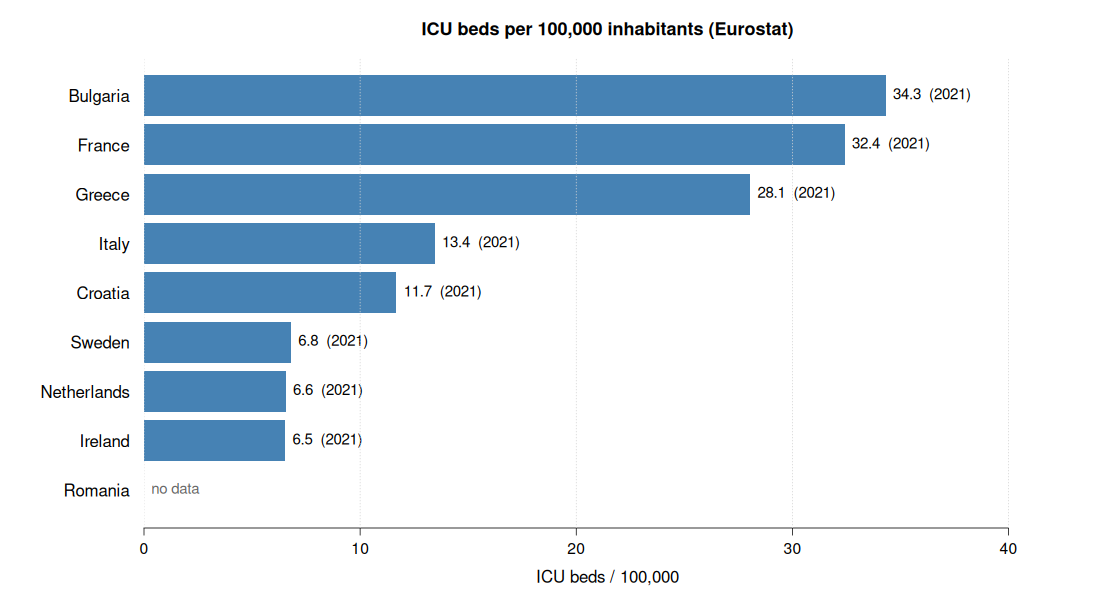
The result is not what one would expect: in ICU beds per 100,000 inhabitants, as each country declares them to Eurostat, Greece (28.1) is close to France (32.4) and far above Italy (13.4), Croatia (11.7), Sweden (6.8), the Netherlands (6.6) and Ireland (6.5). For the Netherlands the value covers adult beds only, the only ones it declares.
At the top of the chart stands Bulgaria, with 34.3 beds per 100,000 inhabitants, more even than France. It is the country with the most deaths in the whole sample, 5,362 per million against 2,902 for Greece. This first chart therefore already contains an independent indication that the number of beds is not on its own the answer; and as will become clear below, Bulgaria also shares with Greece the lowest nurses-per-bed ratio in the sample.
That number, however, does not survive a reality check. The official Greek sources give far smaller figures for the same period: 565 ICU beds at the start of the crisis, 1,143 in November 2020, around 1,650 at the end of 2021, that is 5.4, 11.0 and 15.8 per 100,000 inhabitants, against the 27.3 that Eurostat reports for 2020.
The difference can be explained. Of the 2,890 Eurostat beds for 2020, 679 are neonatal and 73 paediatric (irrelevant to adult COVID care) and another 188 are high dependency units. That leaves 1,950 "adult critical care" beds, which are still 1.7 times the official 1,143. The remaining gap is that Eurostat counts registered beds across the whole country including the private sector, whereas the ministry figures cover the capacity of the national health system that was in operation.
The same holds for France, though, and even more strongly. The French national sources give 5,415 réanimation beds before the pandemic and 9,860 at the peak of the first wave, against the 22,261 that Eurostat reports. The table shows what remains when the operational figures are used for both countries.
| Country | Before the crisis (national sources) | Peak of the crisis (national sources) | Eurostat 2020 (registered) |
|---|---|---|---|
| Greece | 565 (5.4) | 1,650 (15.8) | 2,890 (27.3) |
| France | 5,415 (8.3) | 9,860 (15.1) | 22,261 (32.9) |
Absolute number of beds; per 100,000 inhabitants in brackets.
The result changes the figures but not the conclusion; it strengthens it. Greece started from a lower base (5.4 against 8.3 beds per 100,000), but at the peak of the crisis the two countries had essentially the same ICU capacity per inhabitant: 15.8 for Greece, 15.1 for France. Both got there the same way, by converting operating theatres, recovery rooms and other units; the French study states this explicitly for its 4,806 additional beds.
So the question "did Greece have fewer beds?" does not explain the difference, neither with the registered Eurostat figures nor with the operational ones. If there is a break between the Greek performance and the French reference, it must be looked for elsewhere: in the staff that would support those beds in practice.
Sources: ICU beds Greece (covid19.gov.gr, Ministry of Health 11/2020, OT.gr) · ICU beds France (PMC 7534597, PMC 8069631).
Staff
In staff, however, the picture is completely reversed. With 338 nurses per 100,000 inhabitants Greece is last in the sample, below Bulgaria (421), Italy (626), Croatia (701) and Romania (772), and at a quarter of Ireland (1,280), France (1,134), the Netherlands (1,108) and Sweden (1,085). Note: France reports "professionally active" nurses to Eurostat while the rest report "practising" nurses, a slightly broader category.
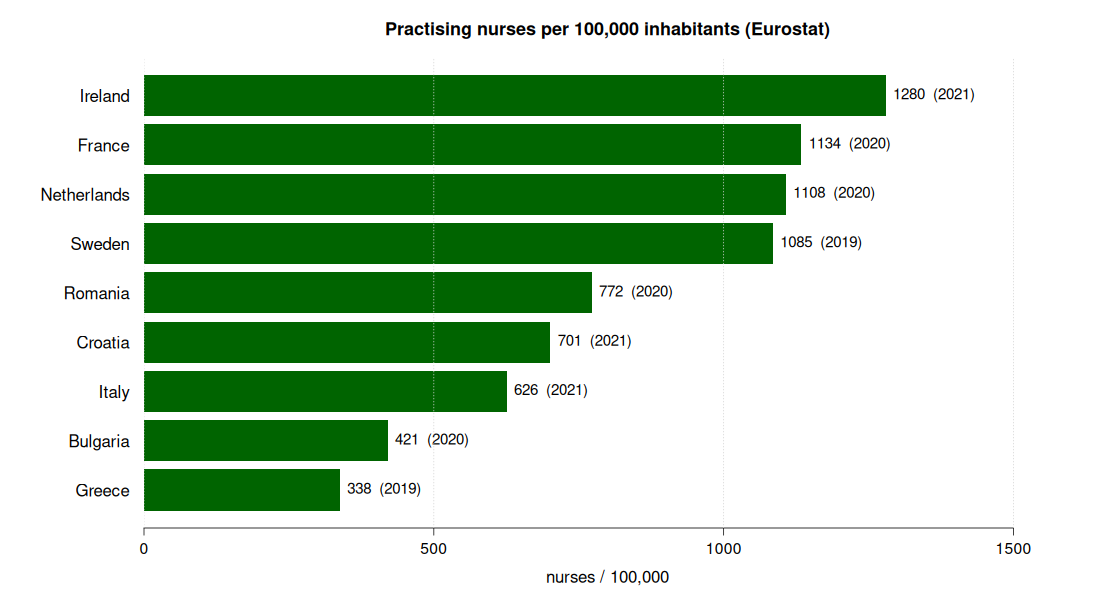
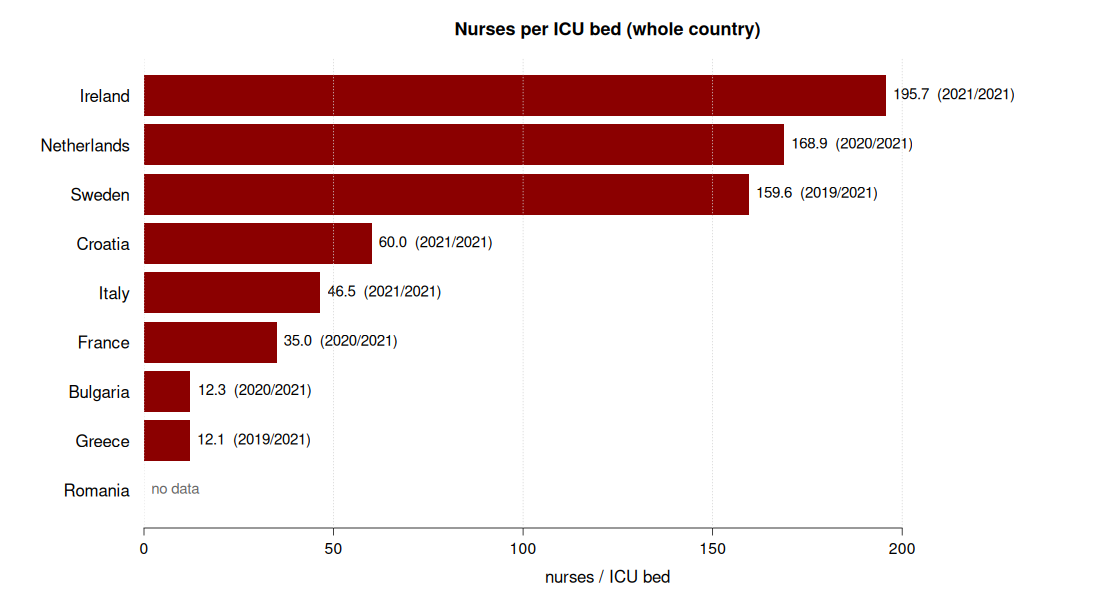
An ICU bed without a nurse is a bed on paper only. The nurses-per-ICU-bed ratio combines the two previous charts and shows the size of the difference: Greece 12, Bulgaria 12, France 35, Italy 47, Croatia 60, Sweden 160, the Netherlands 169, Ireland 196. The comparison with France is the cleanest: a similar number of operational beds at the peak of the crisis, but a far larger pool of nursing staff to support them. And the two countries that in the death charts follow Greece until 2021 and then break away, the Netherlands and Ireland, have ten times the staffing per bed.
The chain: case → hospital → ICU → death
Beds and staff are structural quantities. What actually happened is better seen by following the whole chain, for the period after vaccination. Only the countries that report admissions (rather than occupancy) for both hospital and ICU are compared.
| Country | Cases | Hospitalised | ICU | Died | Deaths per 100 cases | Deaths per 100 admissions | ICU per 100 admissions |
|---|---|---|---|---|---|---|---|
| Greece | 31.4% | 0.95% | 0.073% | 0.168% | 0.54 | 17.7 | 7.7 |
| Czechia | 23.7% | 0.70% | 0.098% | 0.094% | 0.40 | 13.3 | 13.9 |
| Ireland | 26.9% | 0.52% | 0.022% | 0.051% | 0.19 | 9.7 | 4.2 |
| France | 37.5% | 0.47% | 0.070% | 0.055% | 0.15 | 11.7 | 14.7 |
| Spain | 19.2% | 0.42% | 0.031% | 0.058% | 0.30 | 13.9 | 7.4 |
| Italy | 23.7% | 0.35% | 0.025% | 0.068% | 0.28 | 19.6 | 7.1 |
| Netherlands | 38.0% | 0.24% | 0.030% | 0.027% | 0.07 | 11.4 | 12.7 |
Click a column heading to sort the table.
The first four columns are percentages of the population, sorted by the breadth of hospitalisation. Greece hospitalises the largest share of its population in the sample, twice that of France and almost four times that of the Netherlands, and has the most deaths, three times those of France. Yet it moves just 7.7% of those hospitalised on to ICU against 14.7% in France, that is half the escalation, even though at the peak of the crisis the two countries had almost the same ICU beds per inhabitant.
The "deaths per 100 admissions" column needs care in reading. It does not measure how many died but how lethal the average hospital stay was, and it depends decisively on whom each country admits. Italy, with sensible admission criteria, hospitalises the fewest of the four large countries in the table (0.35% of the population): fewer admissions means heavier cases, hence reasonably more deaths per admission. Italy's 19.6% is not a sign of poor care, it is the expected result of selectivity.
This relation is clearly visible in the three countries with comparable admission logic: France 0.47% of the population and 11.7 deaths per 100 admissions, Spain 0.42% and 13.9, Italy 0.35% and 19.6. The correlation is almost perfect (r = -0.99. By that logic Greece, which hospitalises two to three times more broadly than all of them, would be expected to have the lowest fatality per admission in the table. Instead it has the second highest. That is exactly where the main indication of understaffing lies.
In the wider sample the simple relation does not hold, and the two exceptions are exactly opposite to each other. The Netherlands hospitalises the fewest of all (0.24% of the population), so it admits the heaviest cases, and yet it loses just 11.4 per 100 admissions. Greece does exactly the reverse: it hospitalises the most, hence also lighter cases, and loses 17.7. The two countries sit at the two ends of the same axis.
The same shows without any reference to hospitalisation at all, with the cleanest indicator we have: deaths per 100 recorded cases. Greece 0.54, Czechia 0.39, Spain 0.30, Italy 0.28, Ireland 0.19, France 0.15, the Netherlands 0.07. Greece is first by a clear margin. The Dutch 0.07 must be read with caution, though: the excess mortality of the Netherlands is three times its recorded COVID deaths, that is the country attributes to the virus far fewer deaths than it actually caused. In Greece the opposite holds: excess mortality is a third higher than the recorded deaths.
And here an easy explanation must be rejected: it is not that more cases were recorded in Greece. Greece recorded fewer cases than France (31.4% against 37.5% of the population) and yet had three times the deaths. Breaking the difference into its components: ×0.84 in recorded cases and ×3.64 in deaths per recorded case. Indeed, if Greece was detecting a smaller share of its infections than France, that would widen the gap, not narrow it. What sets Greece apart is not how many cases were recorded, but what became of those recorded.
Two candidates remain, which these data cannot separate: who got infected (whether the infection reached unprotected elderly people disproportionately) and what care they found. The second leaves a mark on every indicator on this page: last place in staffing, half the escalation to ICU compared with France, and fatality per admission higher than in countries that admit far heavier cases.
A second decomposition, based on hospitalisation instead of cases, gives this: of the threefold deaths, a factor of two comes from the number of admissions and a factor of one and a half from fatality per admission, that is 63% and 37%. Care is needed in reading this, though: the number of admissions is not only an epidemiological quantity but also an admission decision: twice as many people hospitalised does not mean twice as many fell ill.
Caveats
Three, and they are necessary. First, the definition of an "ICU bed" is not the same everywhere: the first chart overstates each country's operational capacity (Greece's by a factor of 1.8, France's by 2.3), so the bars can be compared only as orders of magnitude. Second, the nurses-per-bed ratio is computed with the total number of nurses in the country, not only ICU nurses; it is an order-of-magnitude indicator, not shift staffing.
Third, the number of admissions itself does not mean the same thing everywhere: if Greece records as a COVID admission every admission with a positive test while other countries record only admissions because of COVID, then part of the Greek difference is an accounting artefact, and that we cannot tell apart from the data. For deaths, however, the same question has been answered: excess mortality, which depends on no definition, is in Greece 8% higher than the recorded COVID deaths across the whole pandemic and 33% higher in the period after vaccination. The country under-records, it does not over-record.
Data sources: Eurostat hlth_rs_bdsicu (ICU beds), hlth_rs_prsns (nursing staff). Hospital & ICU admissions: ECDC. Reference year: the most recent available up to 2021, marked on each bar. For Romania there are no ICU bed data.
See also: Deaths & Vaccination, the conclusion
Leave a comment
Comments are moderated, and appear with the site's next update.